Analytics tools are software programs or online platforms designed to help people work with data more effectively.
They allow you to explore and analyze raw data to identify patterns and trends. And extract useful insights for more informed decision making.
For instance, if you run an online store, data analytics tools can help you understand:
- Which of your products are selling best. And why.
- Who’s buying which products
- How customers behave
- When sales are highest and lowest
- How buyers find your products
- Which marketing tactics are the most effective
- Where in the customer journey prospects drop off
This information can guide business decisions. From inventory management to the customer experience.
Data analytics tools help you grow your business. By providing insights that lead to better decisions, optimized operations, and valuable opportunities.
Here are some of the ways analytics tools promote sustainable business success:
Customer Analysis
Analyze your customers’ behavior, preferences, and feedback. Knowing your customers’ wants and needs means you can tailor your products, services, and marketing strategies to them. And better meet their expectations.
Which can increase customer satisfaction and build loyalty.
Market Trends Research
Identify market trends and emerging opportunities. Stay ahead of the competition by analyzing industry trends, competitor activities, and consumer behavior. And act on new market opportunities before your competitors do.
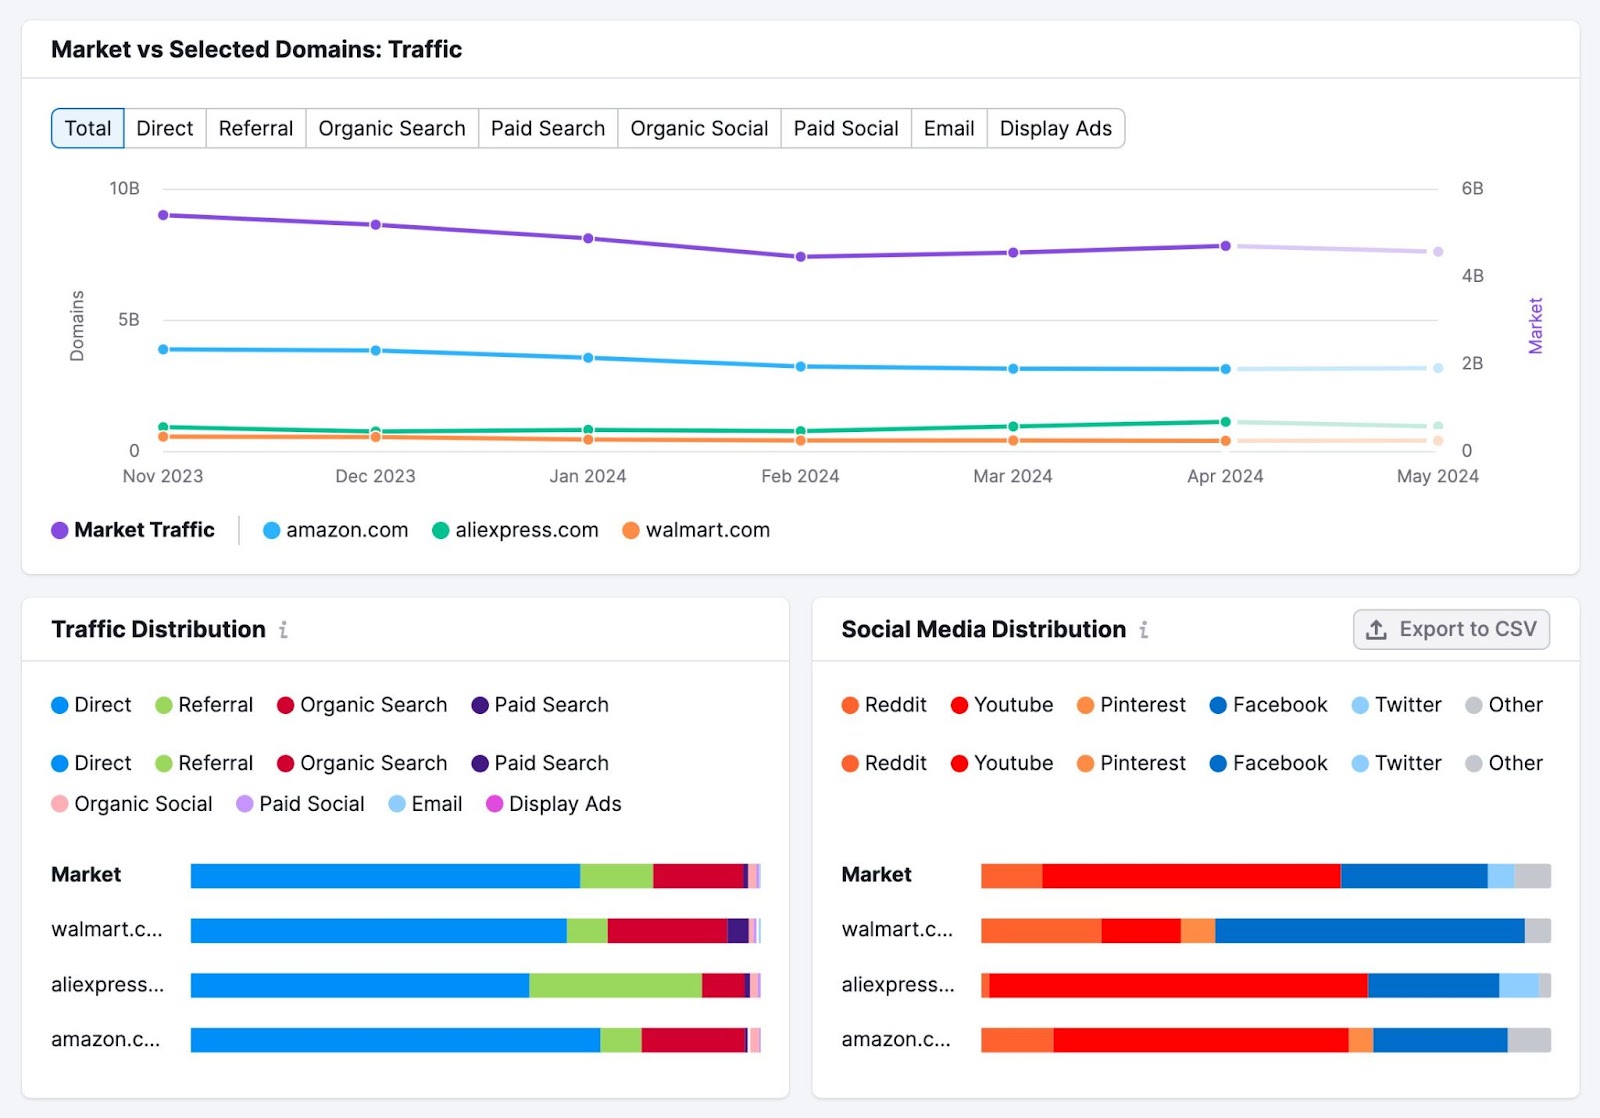
For example, Semrush’s Market Explorer tool lets you compare competitors and gain insights into their website and social media traffic patterns. This can help you identify new marketing niches to target.
Operational Efficiency
Apply insights gained from analytics tools to optimize your business processes.
Analyzing operational data can help you identify inefficiencies, streamline workflows, and cut costs. Leading to greater efficiency, increased productivity, and improved profitability.
Targeted Marketing and Personalization
Use analytics tools to segment your audience. And target customers with personalized marketing campaigns.
Identify high-value customers and observe their preferences. And tailor your marketing messages to target their interests and needs.
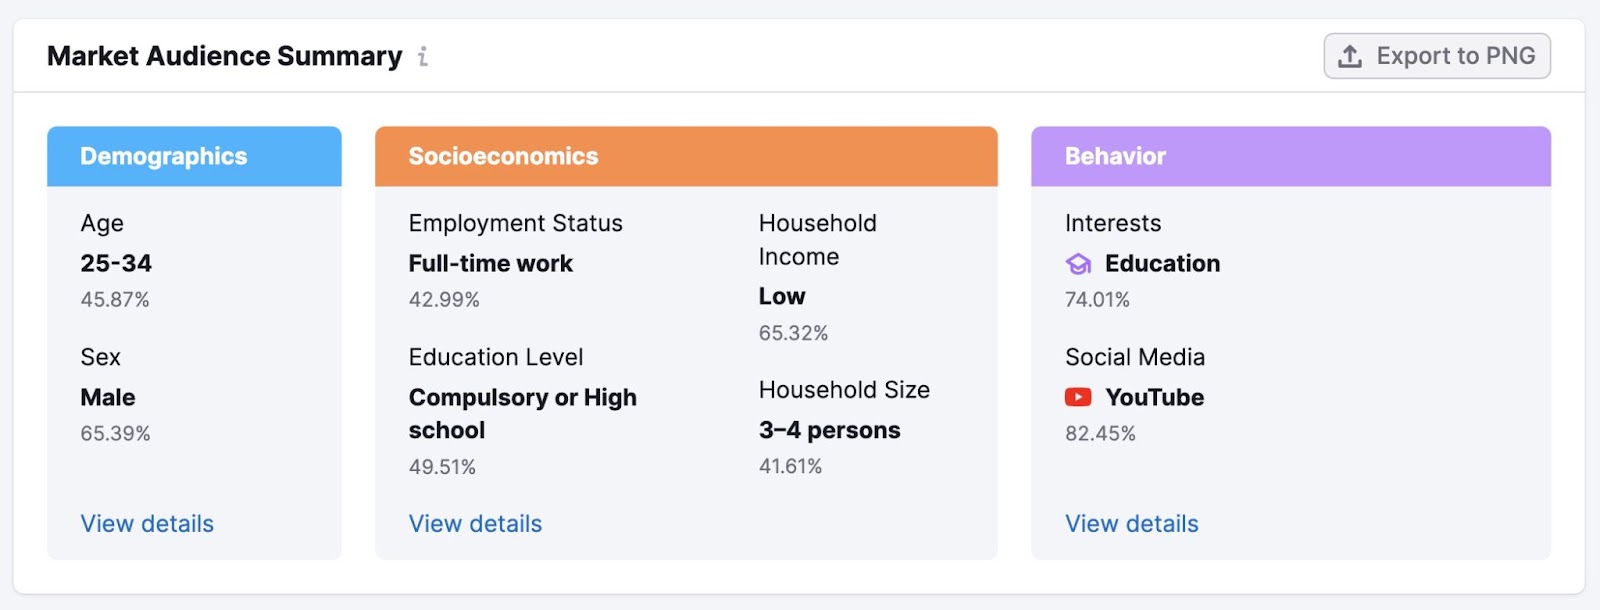
Analytics tools like Market Explorer let you compare competitor audiences. And identity demographics, socioeconomics, and behavior.
Use these details to better target audiences and personalize your marketing.
Risk Management and Fraud Detection
Data analytics tools can help you identify and avoid risks.
Analyze data patterns for unusual activity to detect fraud and identify potential security breaches. And take proactive measures to reduce risks and protect their assets.
Informed Decision-Making
Use analytics tools to make data-driven marketing decisions that lead to higher conversion rates and sales.
Analyzing data from various sources can help you understand your business operations, market changes, and customer behavior. Enabling informed decision-making that drives business growth and success.
The right analytics tools for you will depend on the metrics you want to track, your business goals, and your technical level.
Many tools are user-friendly, like Google Search Console and Semrush. Others, like Apache Spark, have a steep learning curve and require advanced skills. Consider your needs and the technical proficiency of users before investing in a new platform.
1. Google Analytics
Google Analytics 4 (GA4) is a powerful website analytics tool that helps you understand how people interact with your website.
And make informed decisions to improve your website’s performance.
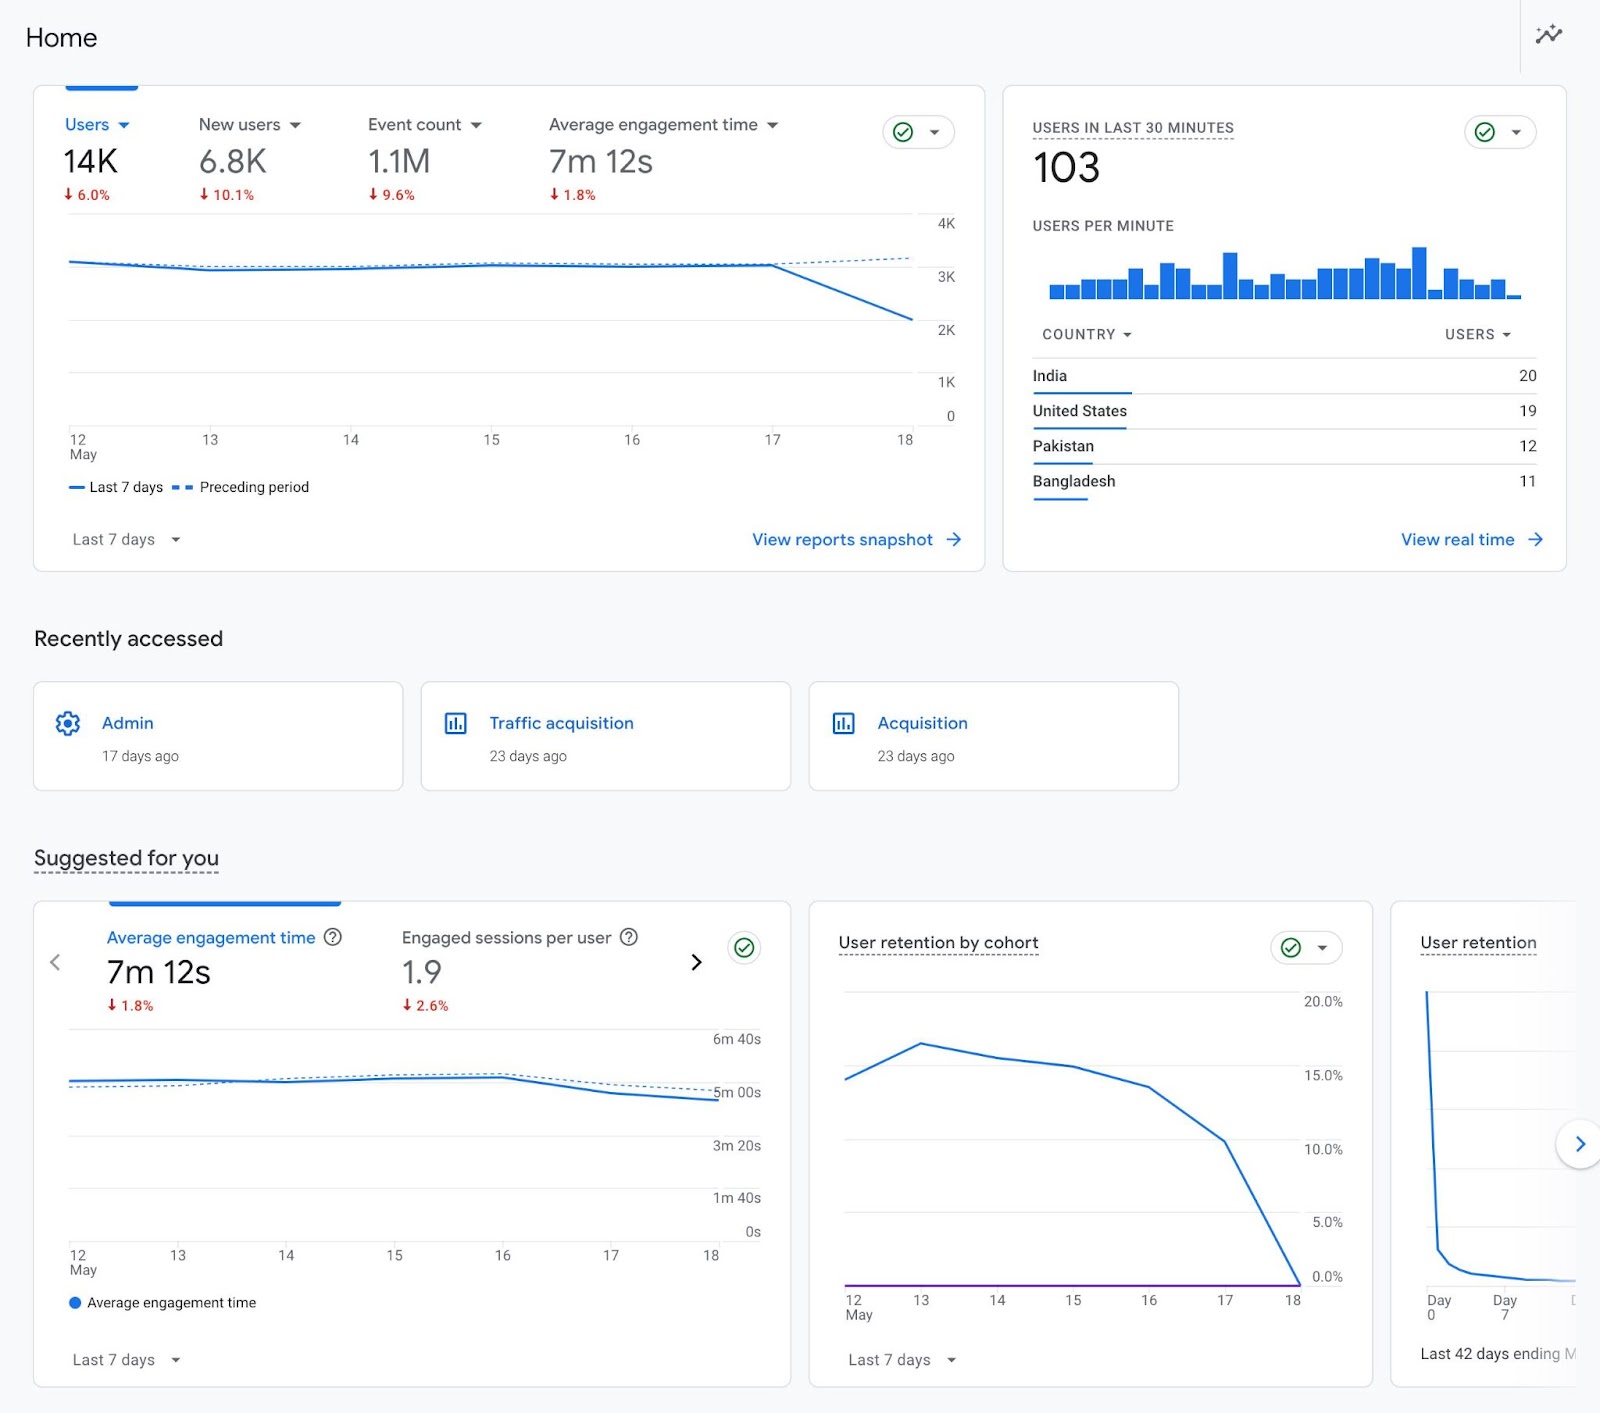
Its main capabilities include:
Website Traffic Analysis
Google Analytics tracks website traffic and user behavior. Allowing you to learn more about who is visiting your site, what they’re doing on it, and how they found it.
GA4 tracks data from all traffic sources, including
- Organic search traffic
- Direct traffic
- Paid search ads
- Social media platforms
Audience Insights
GA4 provides details about your website visitors. Such as their demographics (age, location, and language) and interests.
Get to know who your visitors are. And what they’re interested in. Then, use this information to fine-tune your strategy.
For instance, if you run a travel blog and your site visitors are women in their early twenties, you might create an informational guide for female solo travelers.
Audience Behavior Analysis
See what actions visitors take on your site. Like clicking on links, watching videos, or making purchases. Track user engagement and bounce rates to better understand visitor behavior. And improve your user experience.
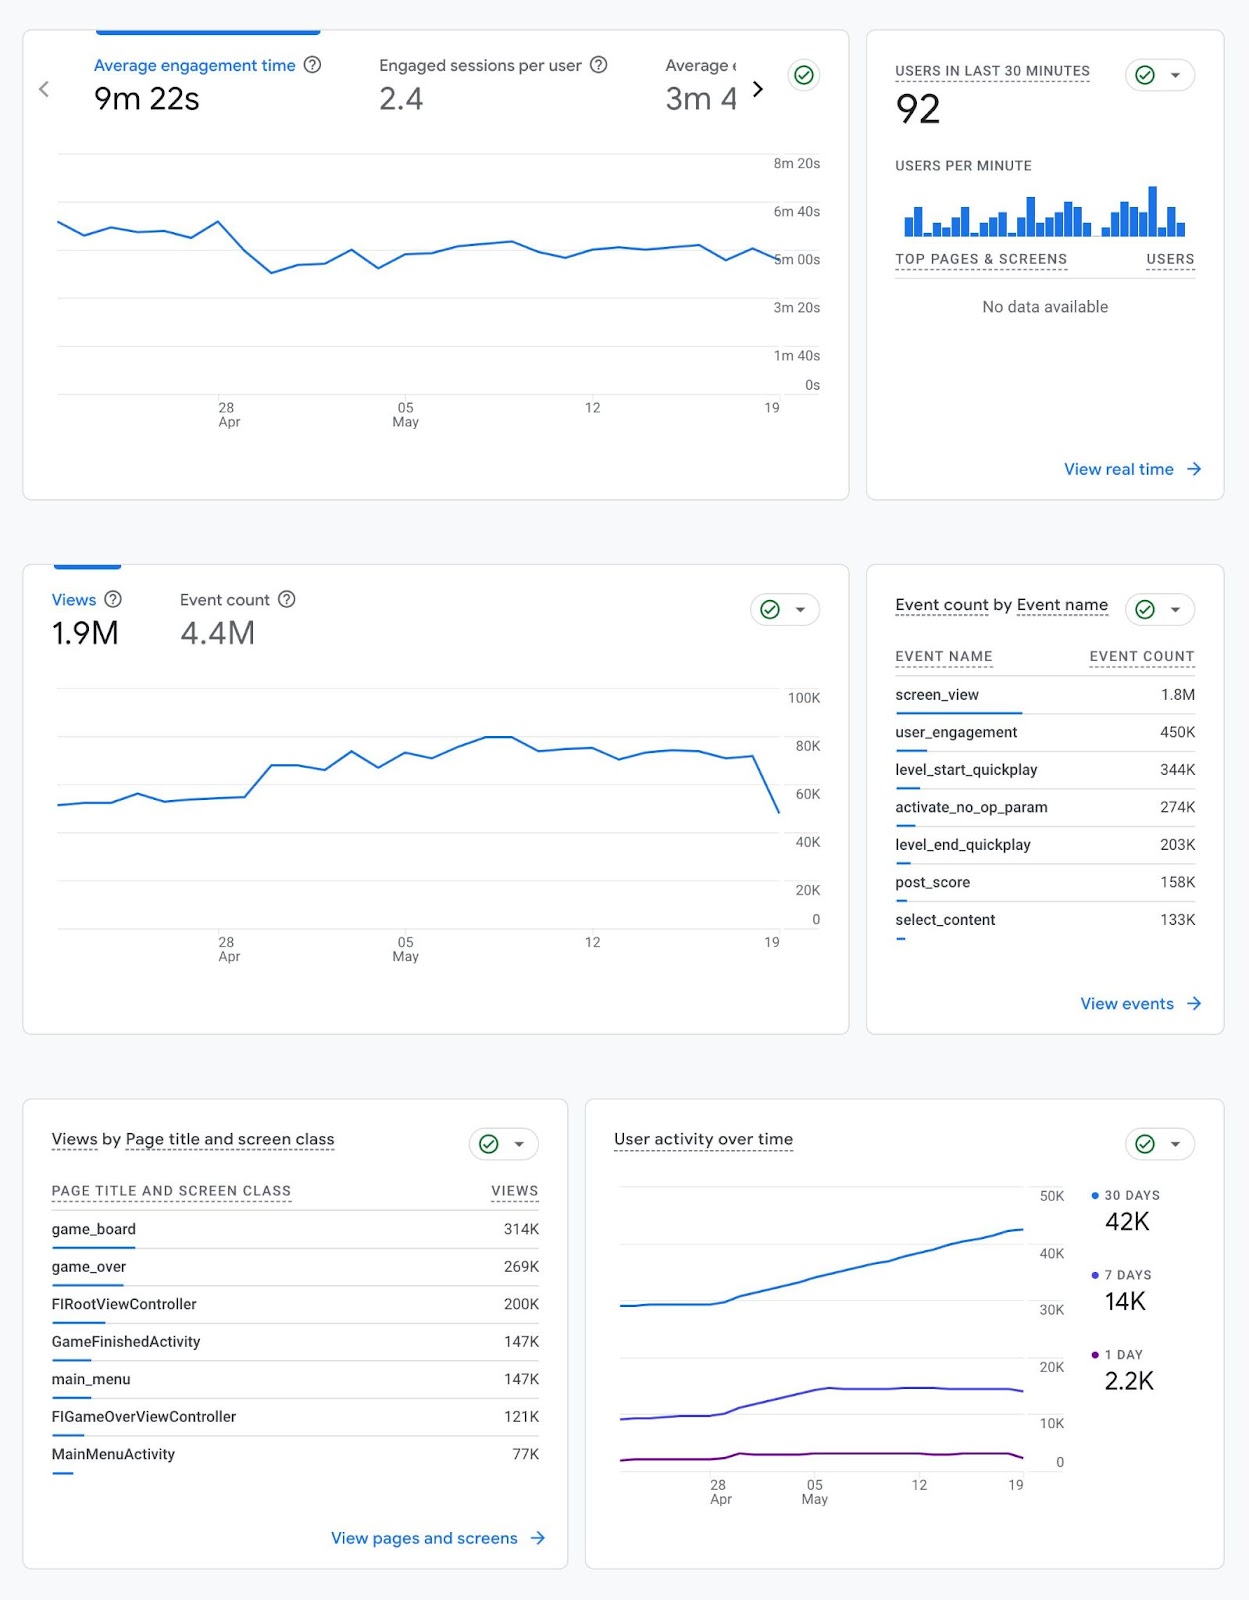
Conversion Tracking
Google Analytics helps you track specific goals, like sales or sign-ups, to see how well your website is performing.
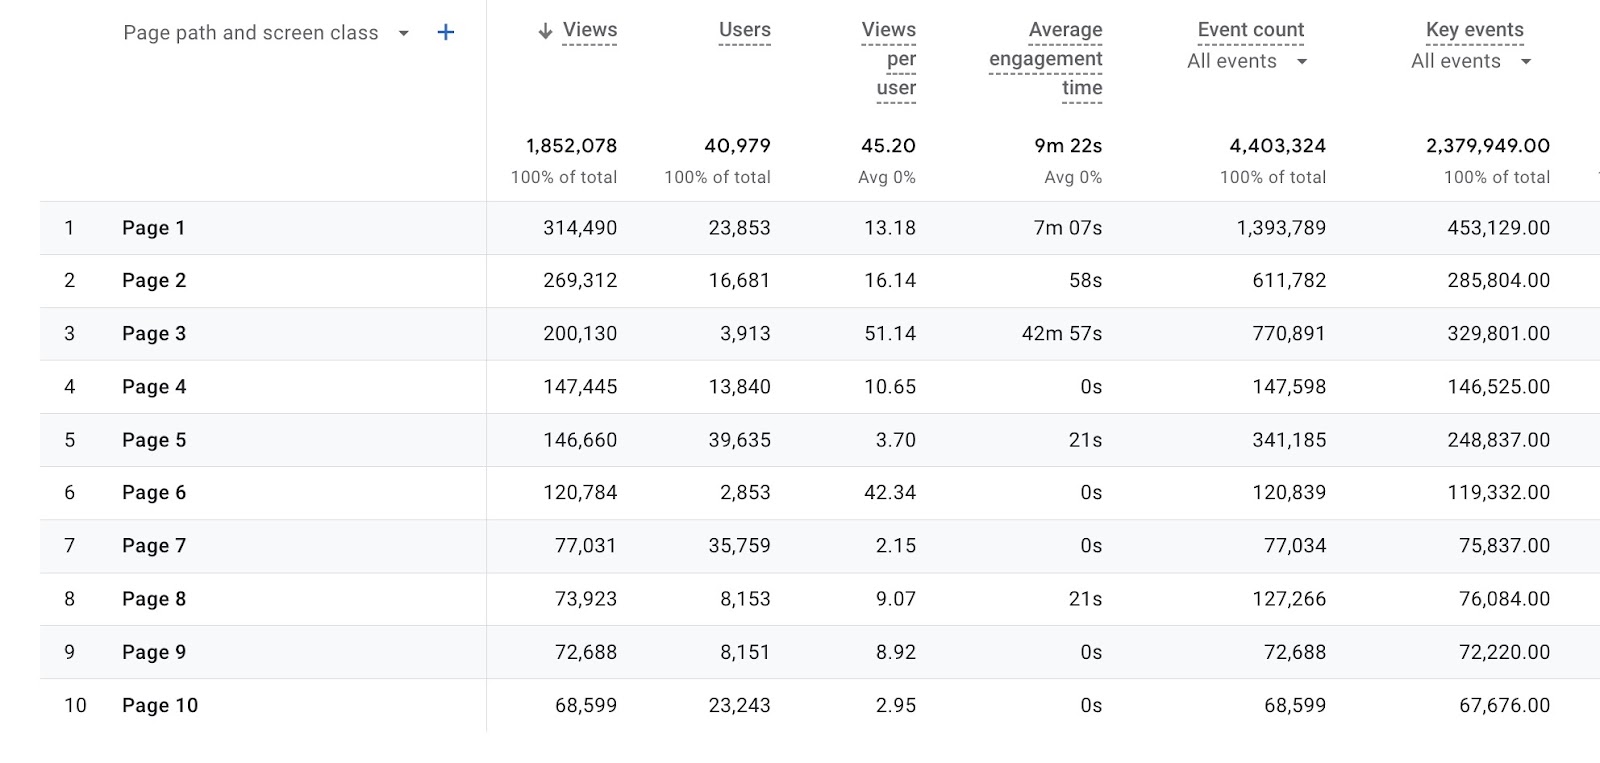
Identify which pages drive the most conversions. And adjust your website content and marketing tactics.
Price: Free
Further reading: What Is an Analytics Dashboard? [With Examples and Tips]
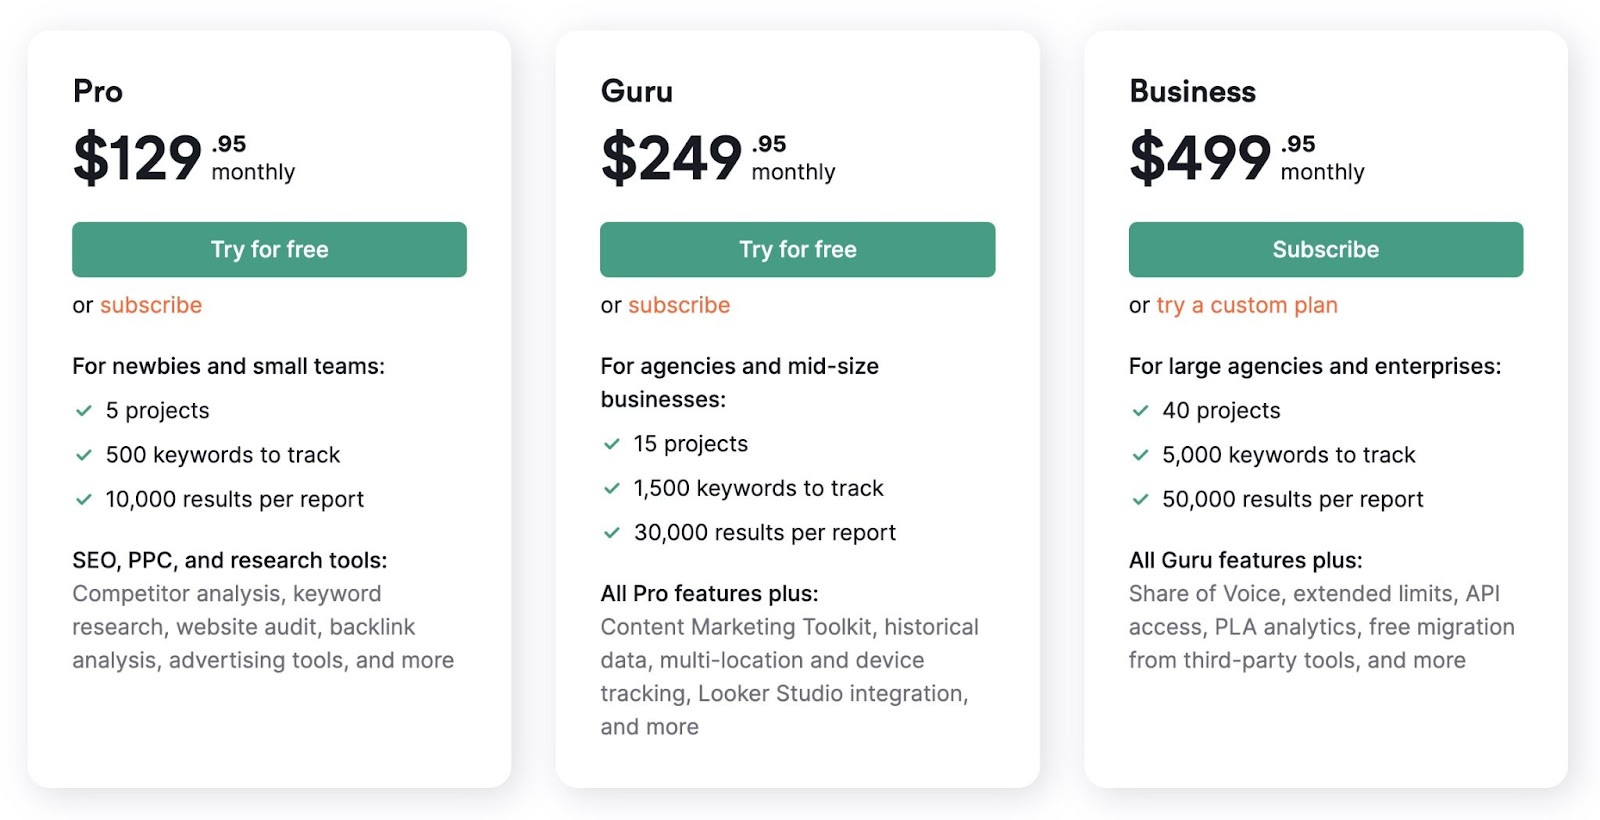
2. Semrush
Semrush is a comprehensive digital marketing analytics solution featuring more than 55 powerful digital analytics tools and reports.
Semrush’s analytics tools can help you with:
- Market research and competitor analysis
- SEO analytics
- Content marketing insights and optimization
- Paid advertising analytics
- Social media management
Here’s what our analytics tools can help you do:
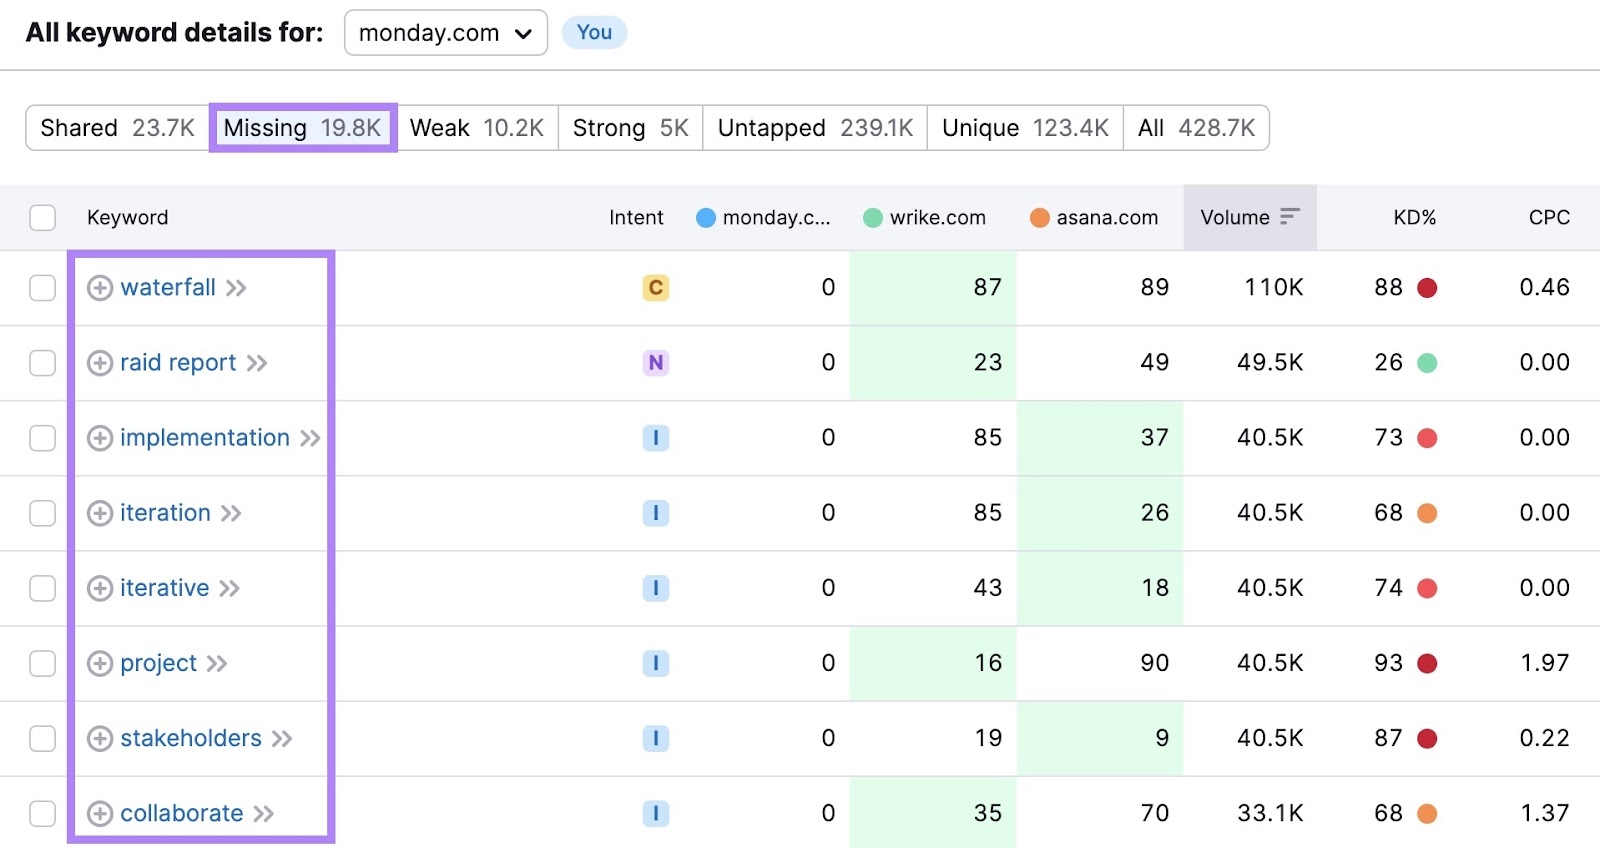
Keyword Research
Our keyword research tools help you discover the words and phrases people type into search engines to find businesses like yours.
- Keyword Overview: Identify keywords to target in content. And compare data like search volume, competitiveness, search intent, and current ranking pages.
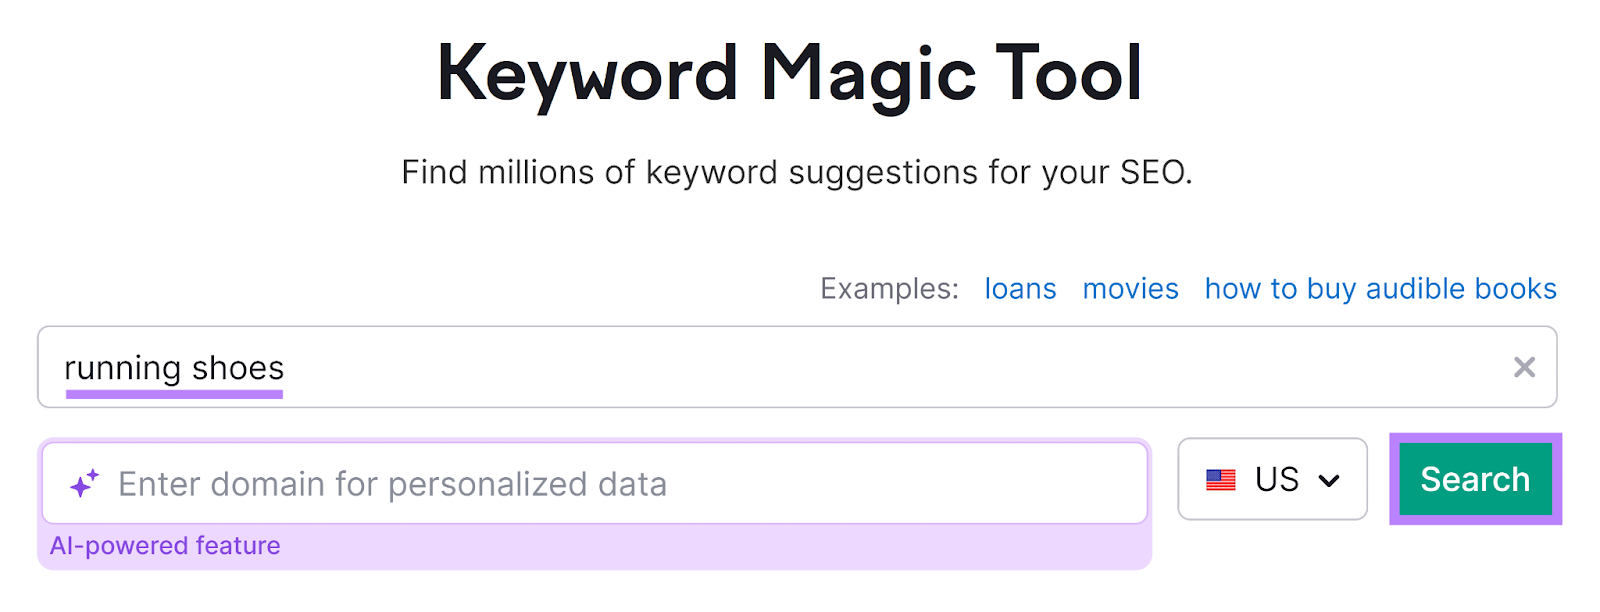
- Keyword Magic Tool: Generate thousands of keyword ideas from a single starting keyword
- Keyword Gap: Analyze competitors to discover content gaps and ranking opportunities
Website Audits
Run a Site Audit to determine if your website has any issues that could reduce its ranking potential. Or harm the user experience.
Explore your Site Health report to understand problems. And get clear instructions on how to address each issue.
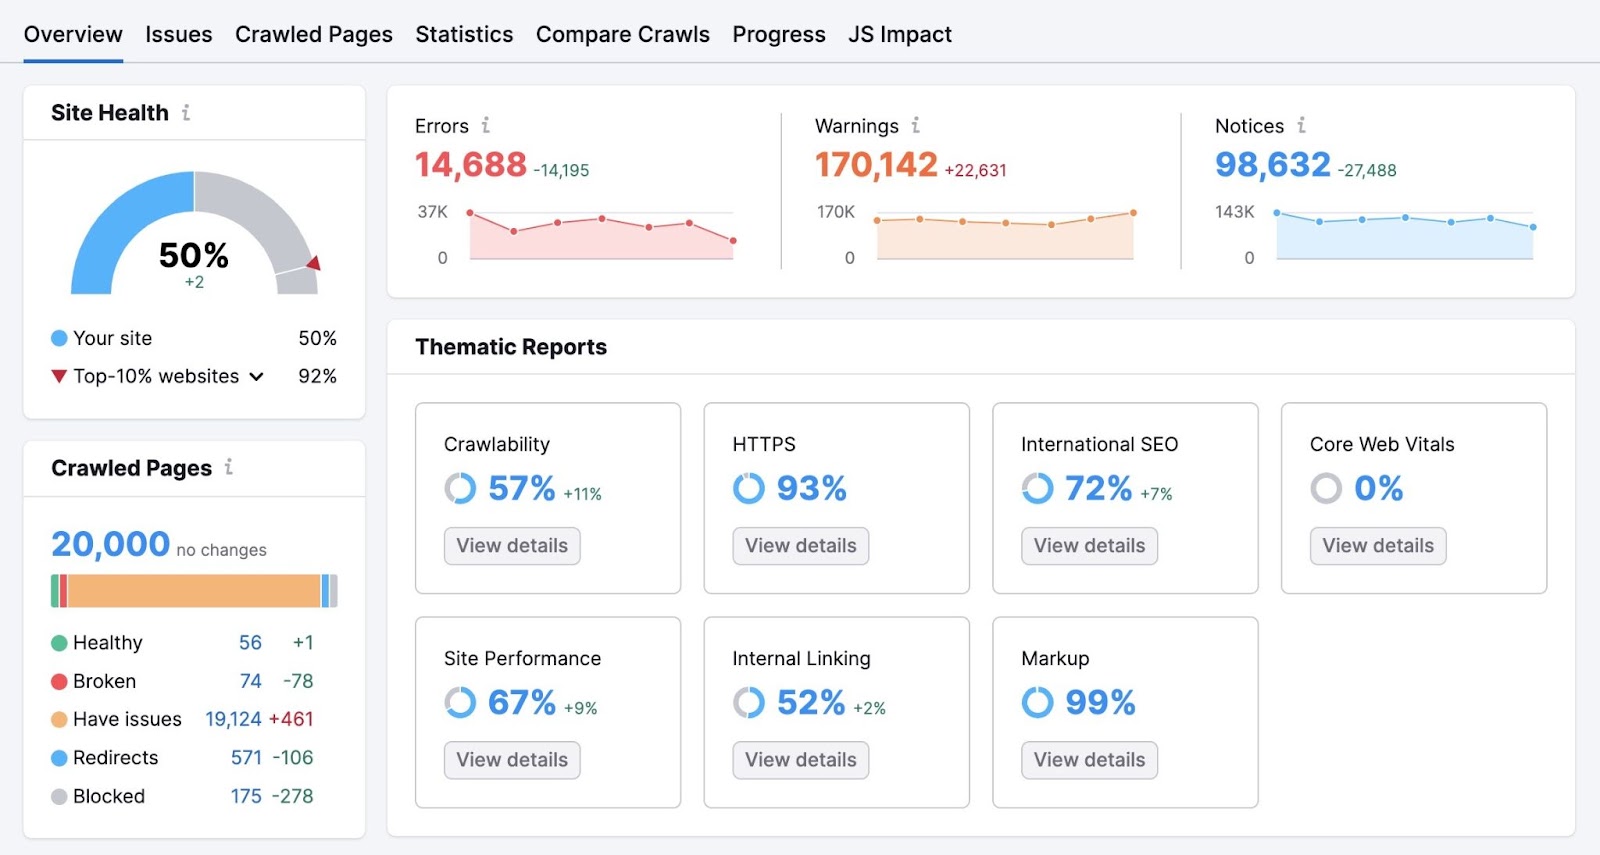
Site Audit can help you identify more than 140 issues impacting your site’s:
- Crawlability
- HTTPS status
- International SEO
- Core Web Vitals
- Site performance
- Internal linking
- Markup
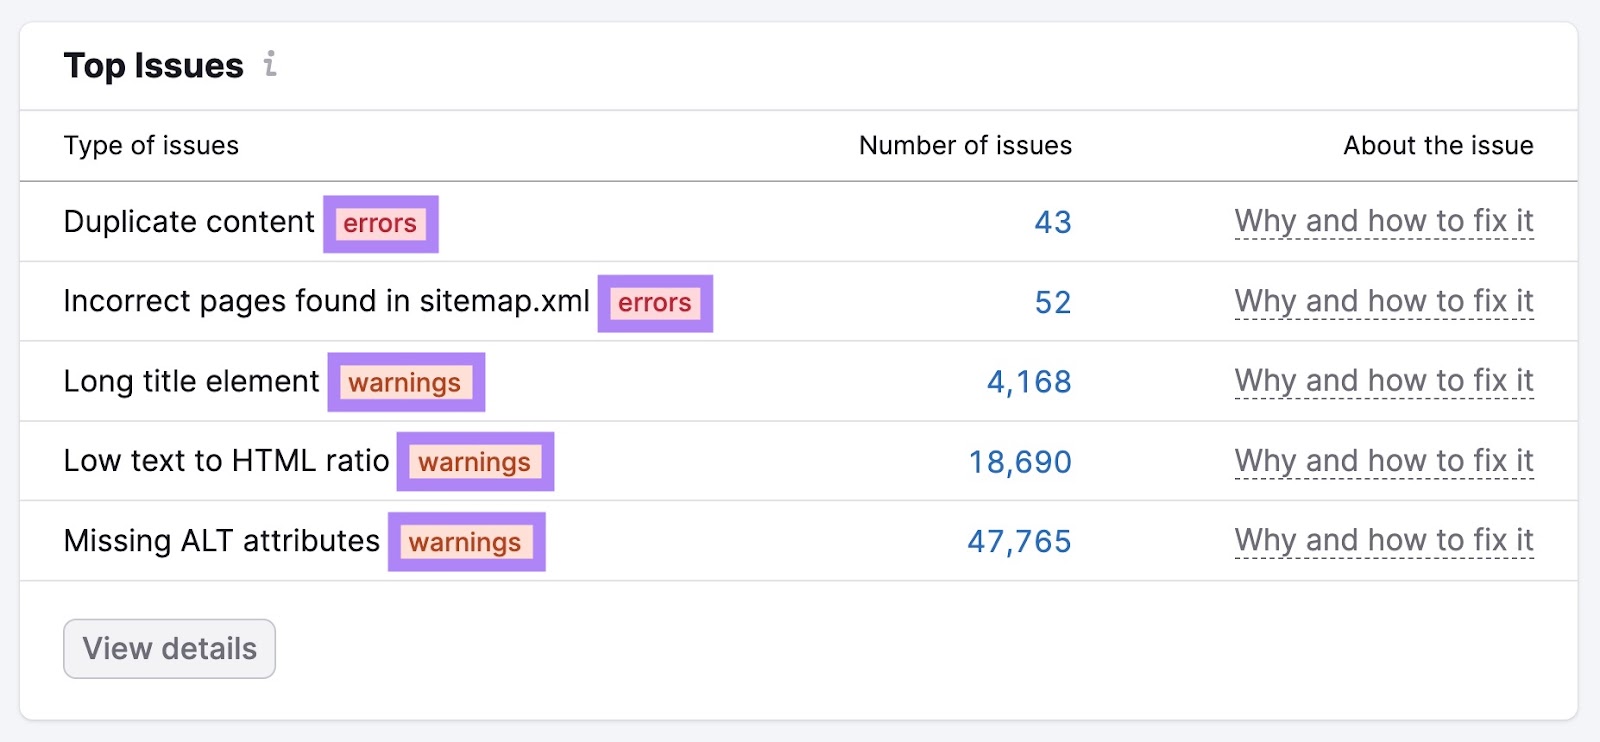
Issues are classified as “Errors,” “Warnings,” or “Notices” in order of severity.
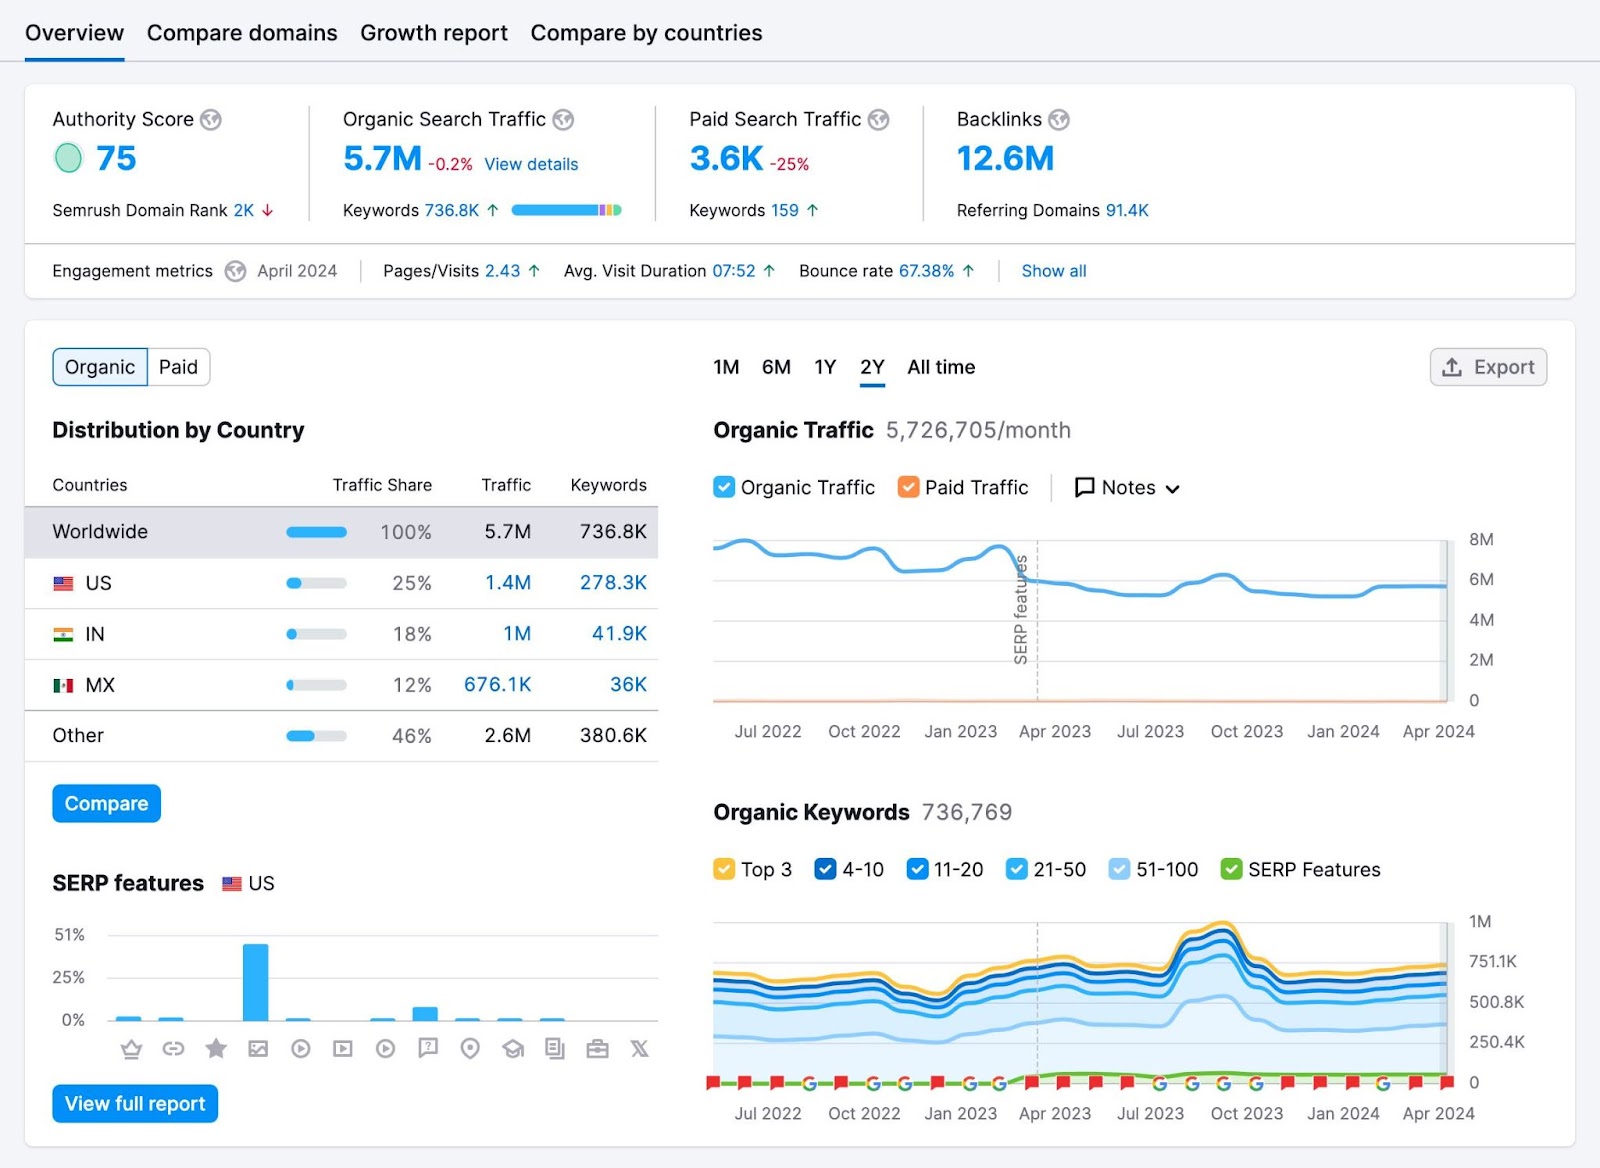
Competitive Analysis
Use the Domain Overview tool to research competitors’ domains.
See what your competitors are doing online. Like which keywords they’re targeting. Or what ads they’re running. This insight can inspire your own campaigns.
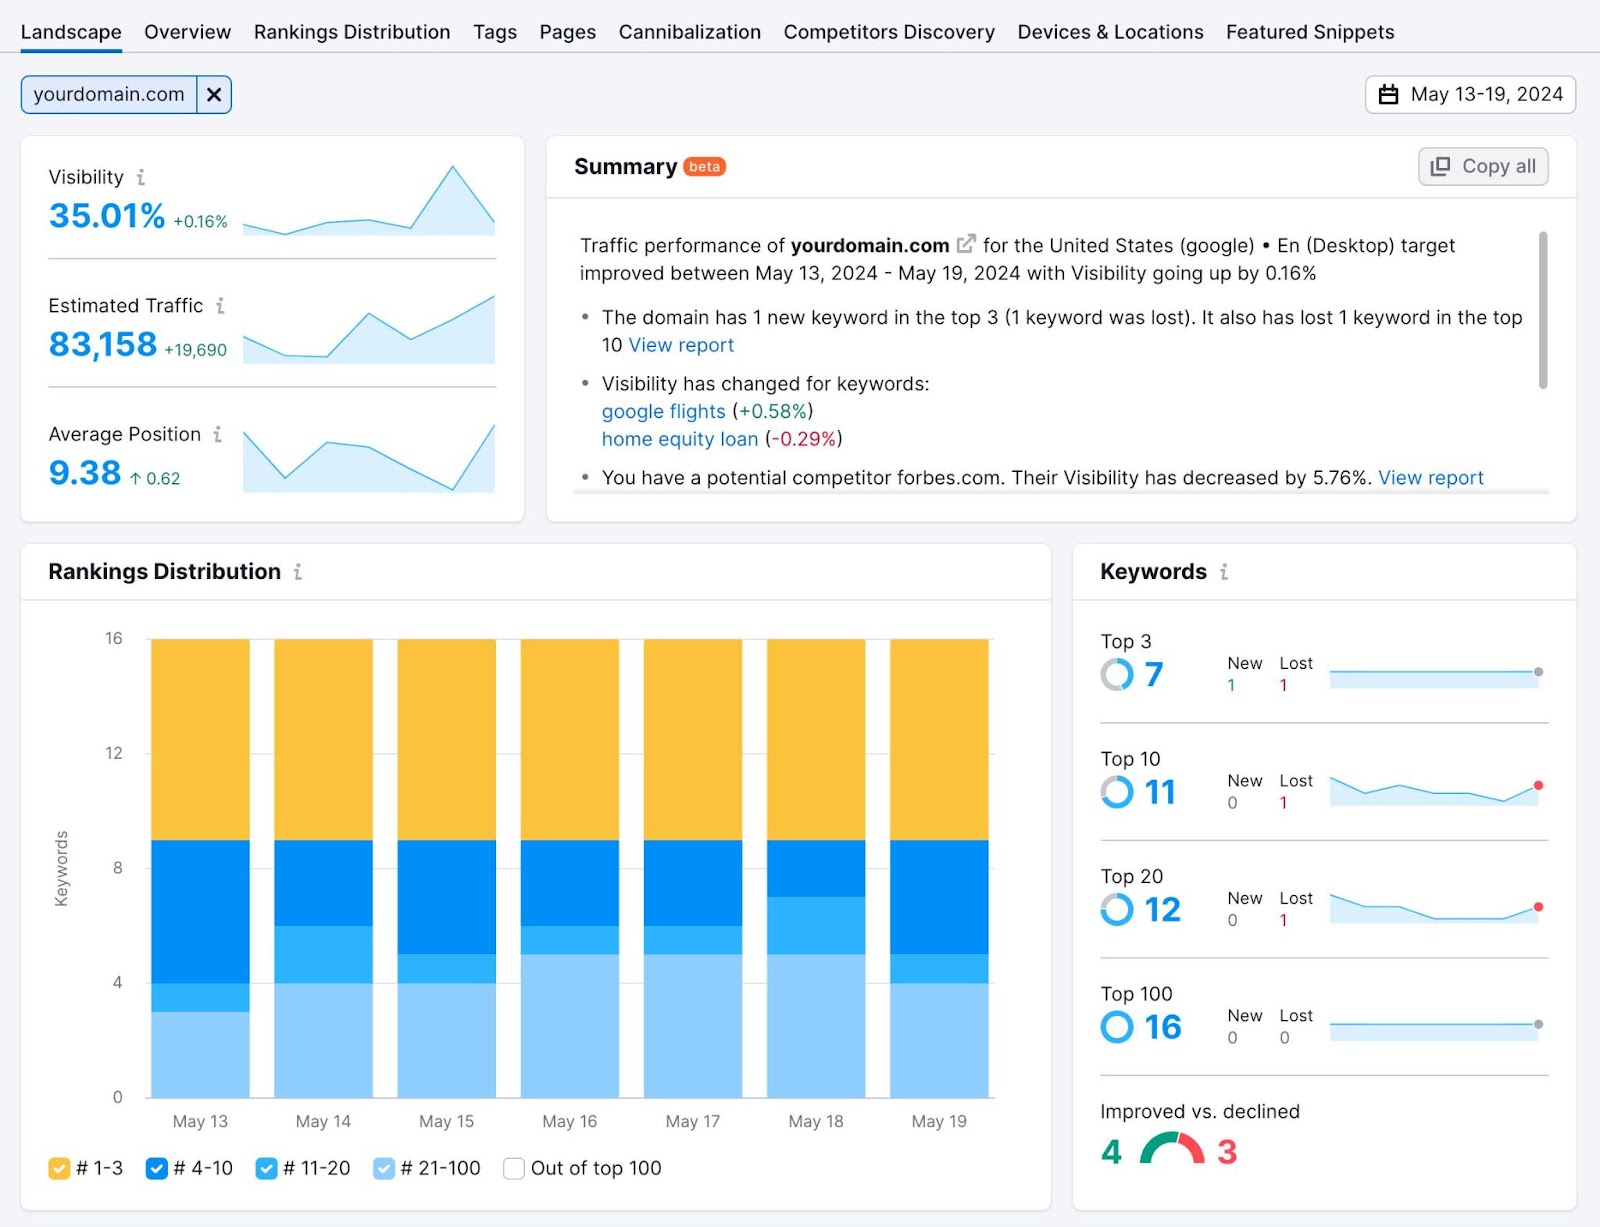
Keyword Position Tracking
Use the Position Tracking tool to monitor visibility, traffic, and position changes in search results.
Price: Starts at $129.95 per month
Further reading: How to Use SEO Analytics: A 4-Step Guide to Success
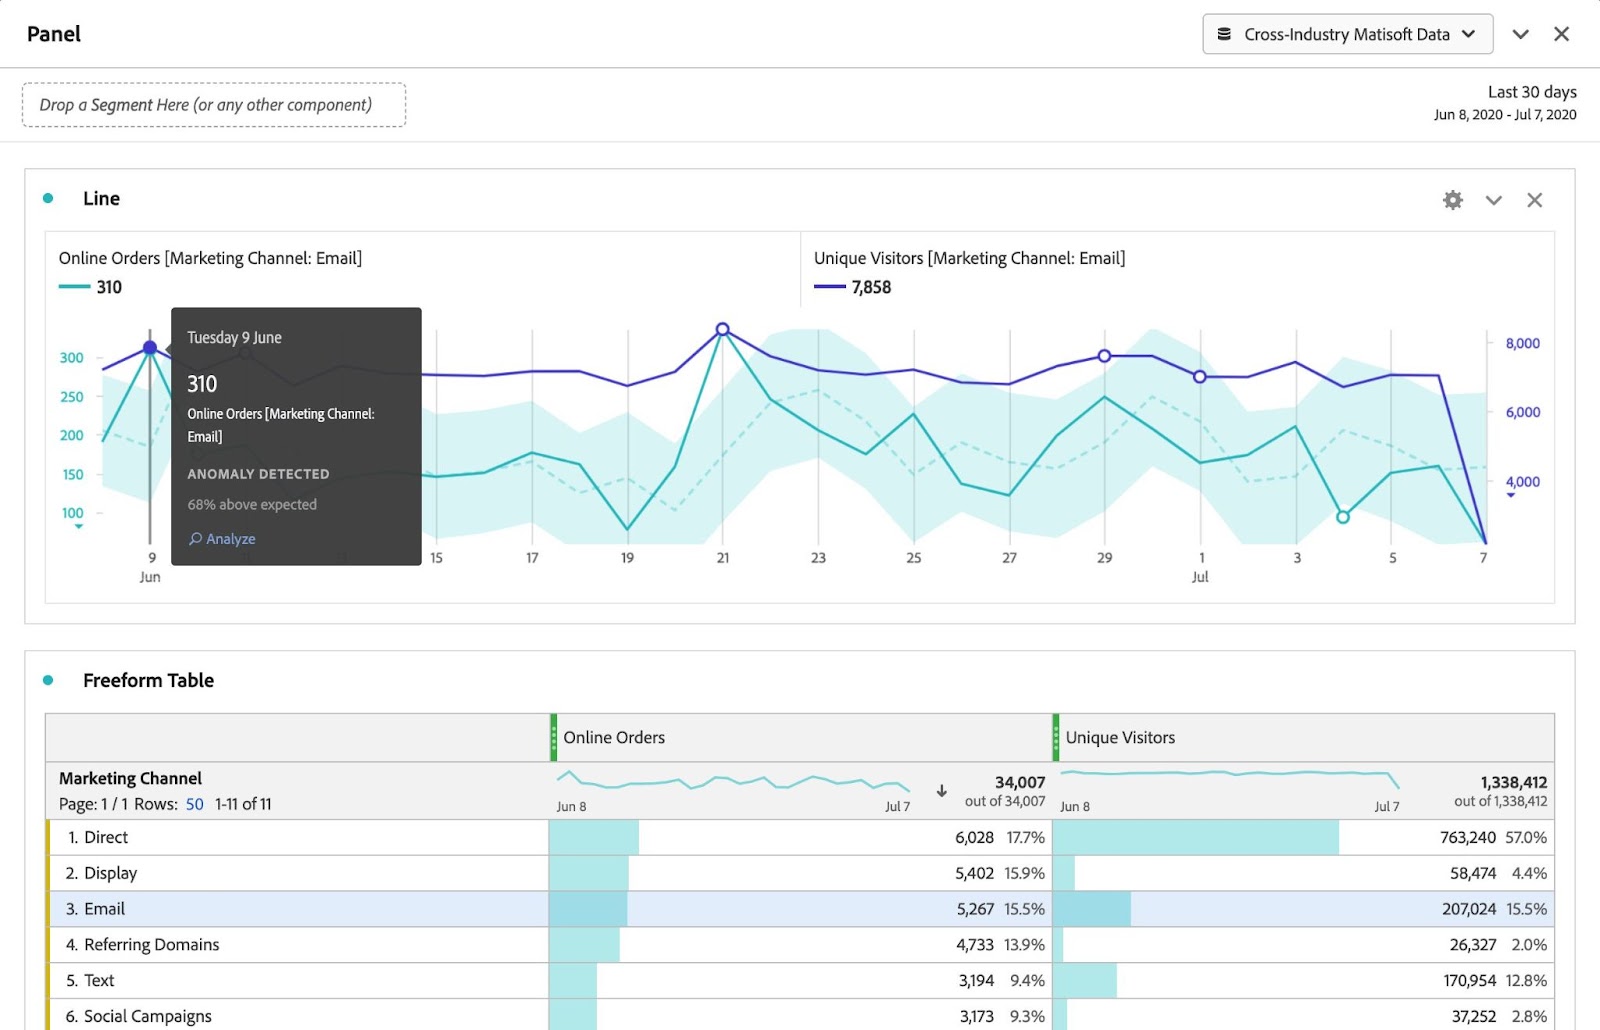
3. Adobe Analytics
Adobe Analytics is a subscription-based web analytics and customer intelligence tool. It helps you make better-informed decisions, improve your operations, and drive business growth.
Adobe Analytics features include:
Data Collection and Analysis
Adobe Analytics collects data from various digital channels. Including websites, mobile apps, and marketing campaigns. It analyzes this data using advanced machine learning to provide valuable insights.
About your customers’ behavior, preferences, interactions, and conversions.
Track where your website traffic comes from, what your audience is interested in, and which marketing channels drive the most sales. And much more.
Customer Journey Analysis
Adobe Analytics lets you aggregate and analyze data across the entire digital customer journey. From first click to post-purchase. Helping you understand how customers behave at various stages of your sales funnel.
Track customers’ interactions with your brand across multiple channels. And identify which touchpoints drive conversions. This enables you to optimize your cross-channel marketing and personalization efforts.
Advanced Segmentation and Targeting
Segment your audience based on demographics, behavior, preferences, and more. Target prospective customers with personalized marketing campaigns and experiences.
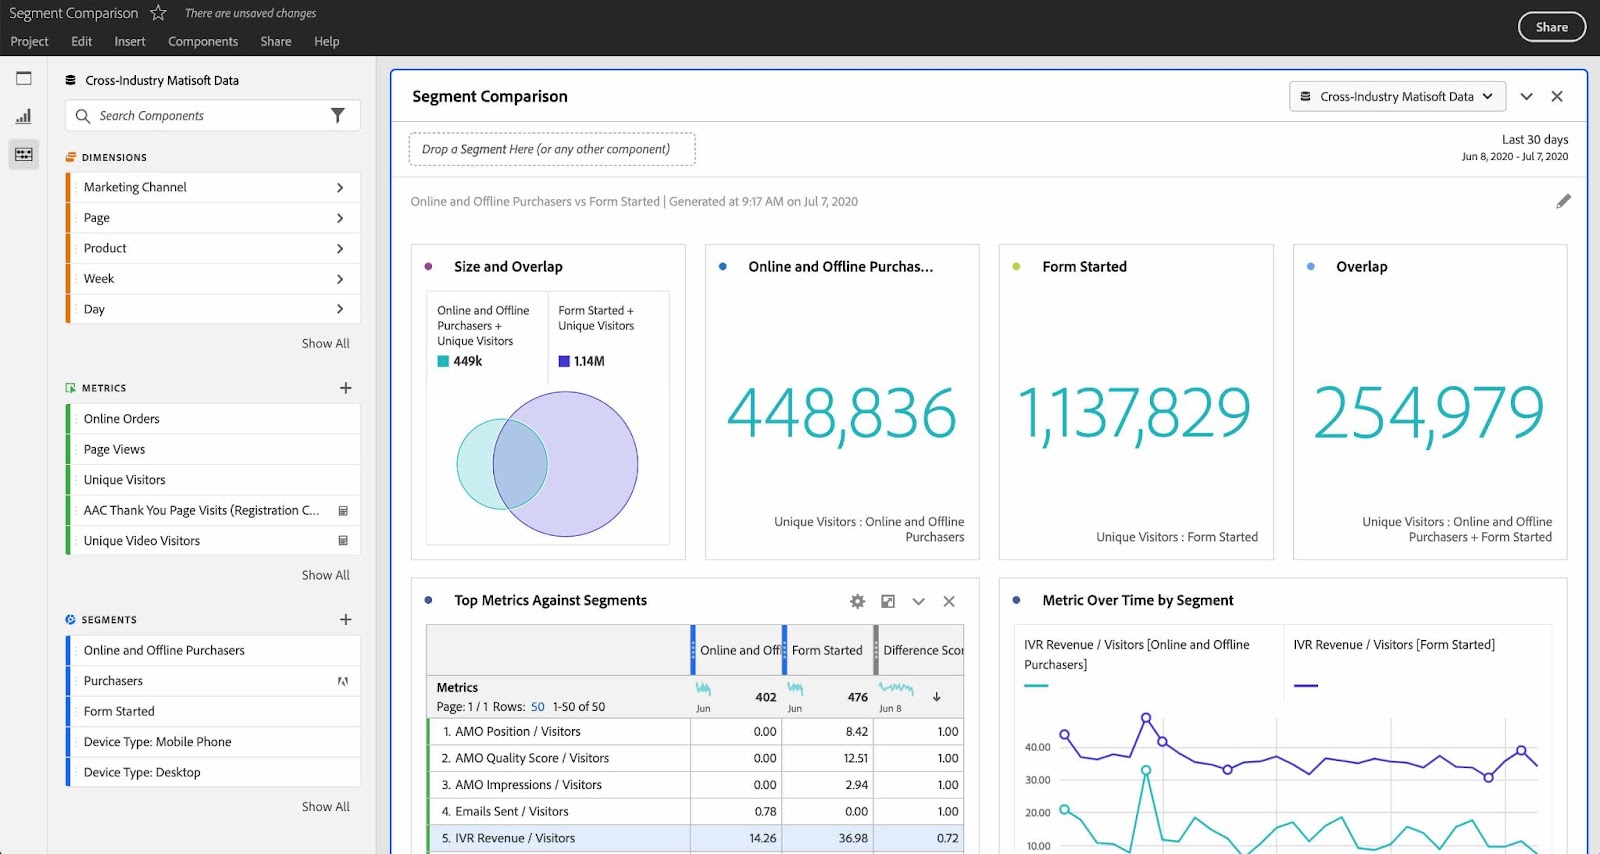
Real-Time Reporting
Real-time reports and dashboards let you track your business’s digital performance metrics live. This includes site traffic and live data. Like how many users currently have items in their shopping carts. Allowing for quick decision-making and strategic action.
Customize your reports and dashboards to track the metrics most relevant to your business.
Integration with Adobe Experience Cloud
Adobe Analytics integrates with other products in the Adobe Experience Cloud ecosystem. Such as Adobe Campaign and Adobe Target.
Price: Pricing available on request.
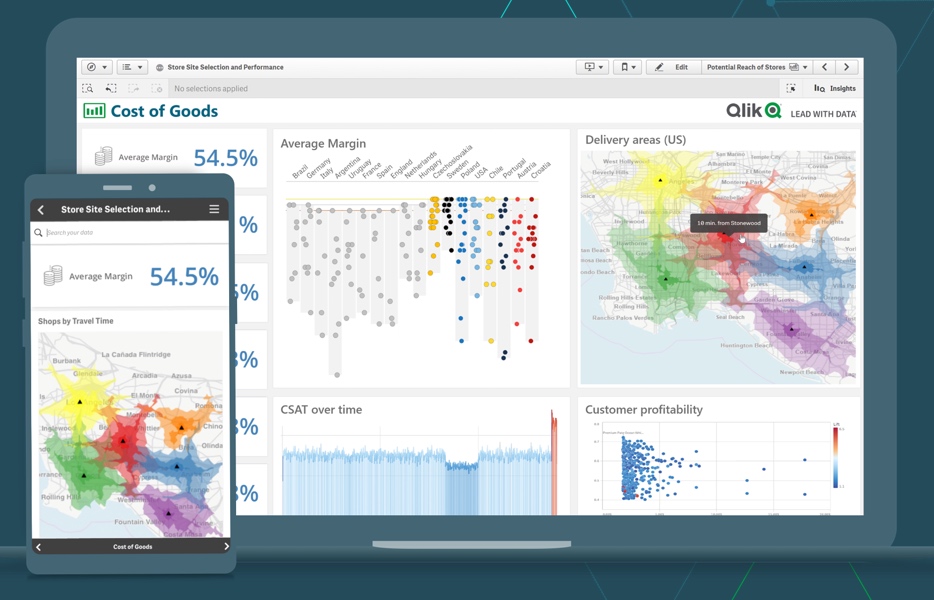
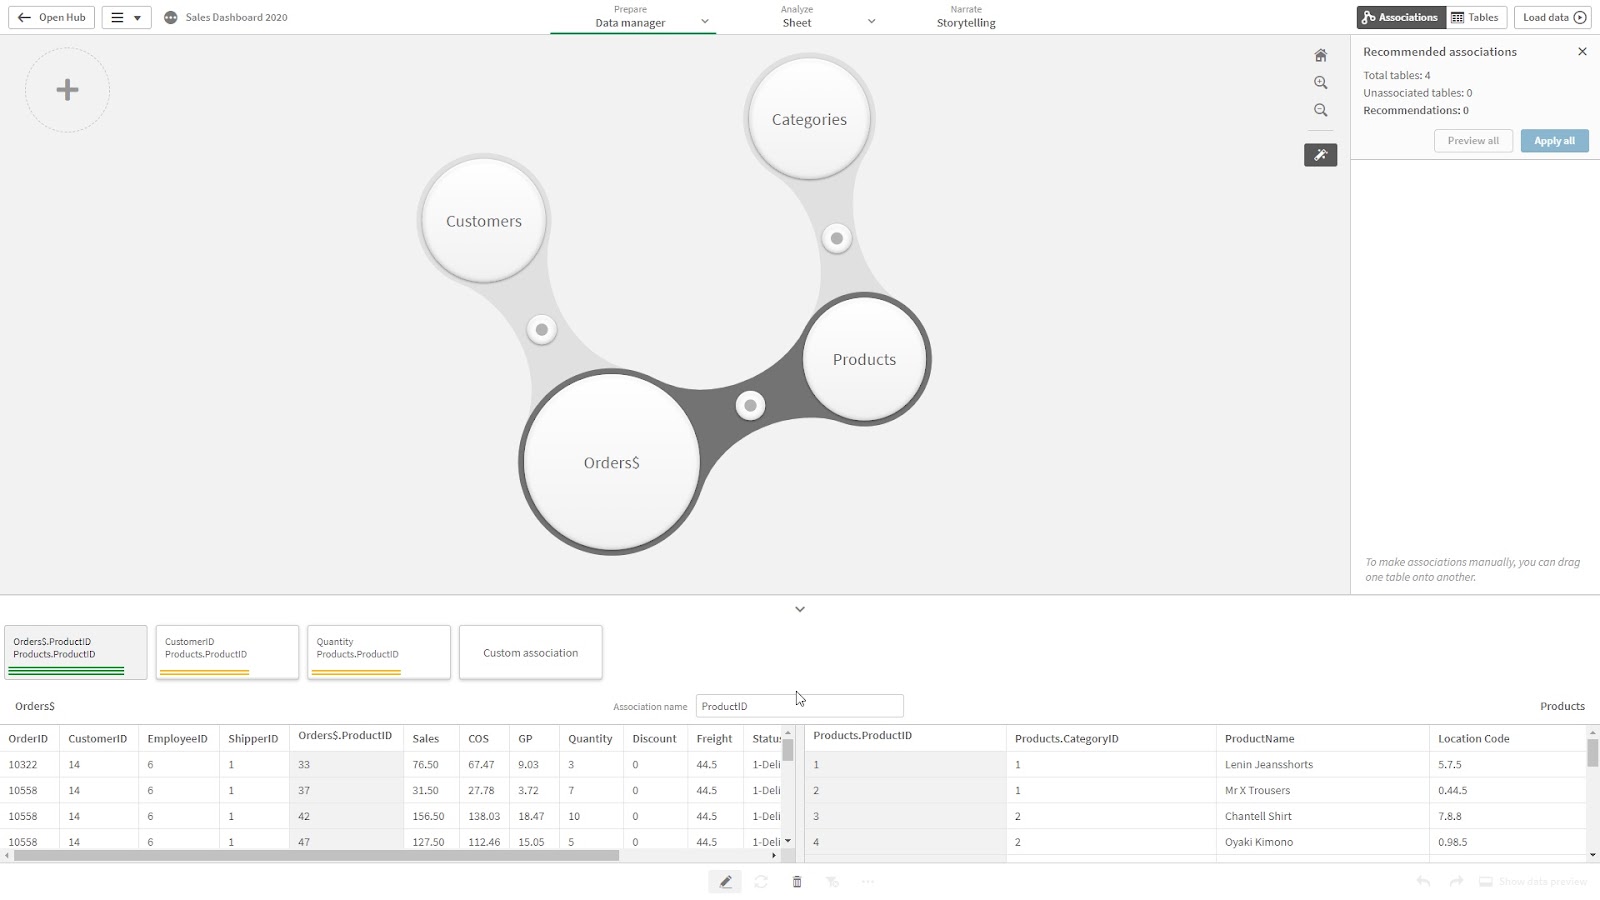
4. Qlik Analytics
Formerly known as QlikView, Qlik Analytics is a user-friendly business intelligence tool. Helping you make sense of your data through interactive visual dashboards.
Its AI-powered augmented analytics capabilities make exploring your data and extracting insights easier. Helping you make data-driven decisions. Even if you’re a non-technical user.
Qlik Analytics features include:
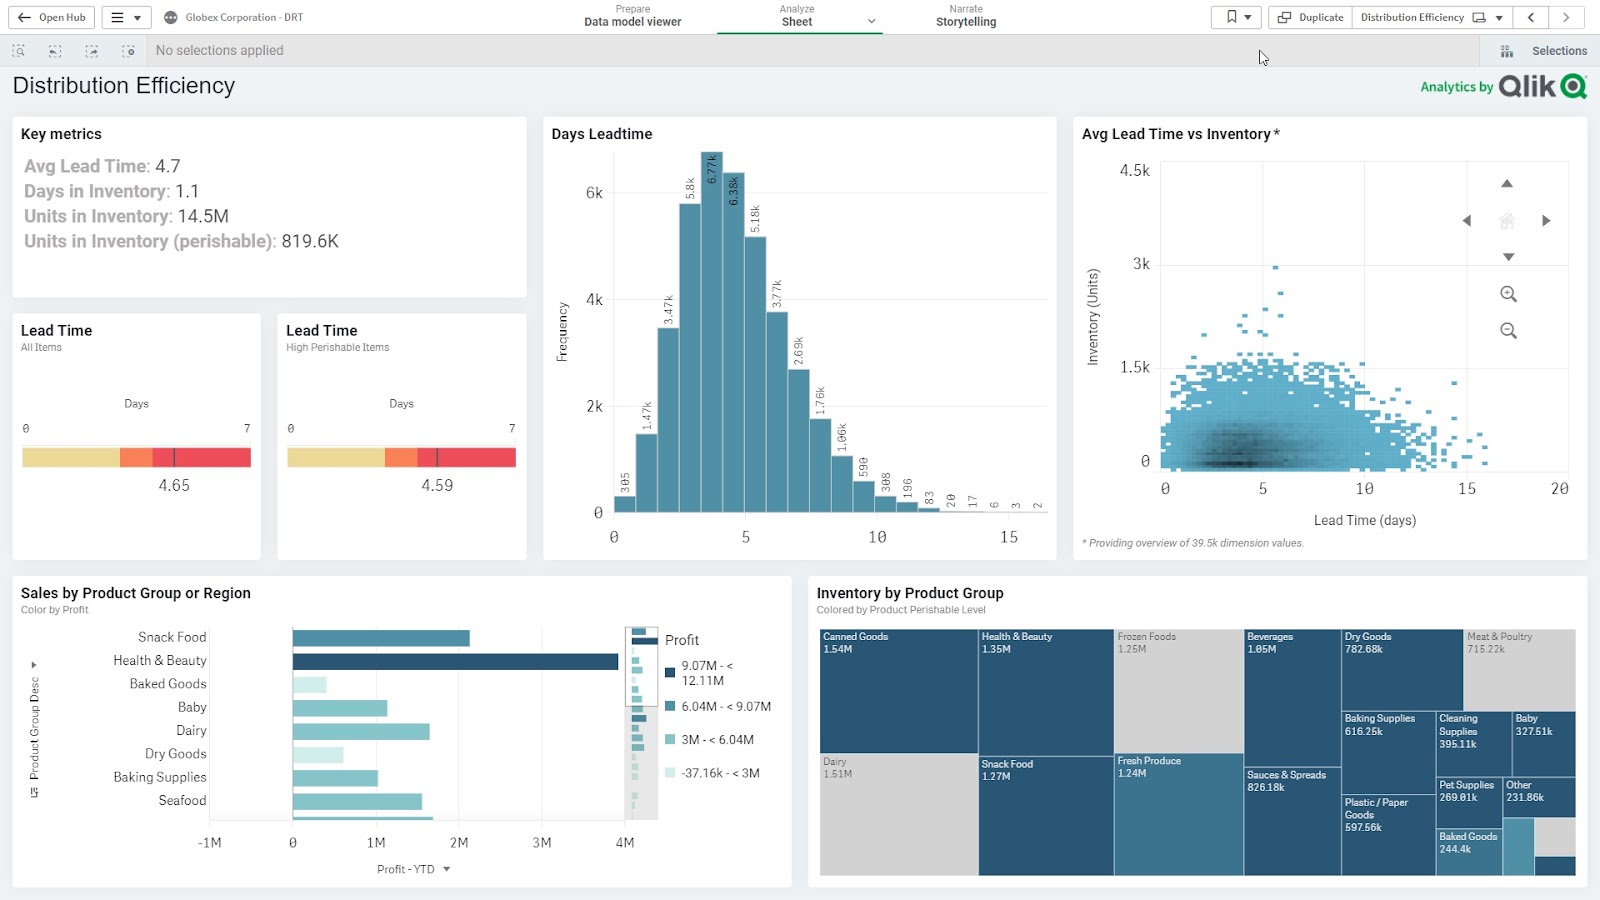
Data Visualization
Qlik Analytics helps you create interactive charts, graphs, and dashboards. Making it easy to understand complex data. Use these visualizations to identify trends, patterns, and outliers at a glance.
Data Discovery
Explore your data by asking Qlik’s AI assistant questions. And get answers in real time. Discover connections between different data points. Leading to new insights that can improve your business and marketing strategies.
Self-Service Analytics
Perform data analysis without relying on IT or data experts.
Qlik’s simple interface and drag-and-drop editor make it easy to create custom reports and dashboards tailored to your specific needs.
Integration and Connectivity
Connect to various data sources. Including databases, spreadsheets, and cloud applications.
Analyze data from multiple sources in one place, gaining a holistic overview of your operations.
Collaboration and Sharing
Qlik Analytics promotes collaboration. Share insights, comments, and annotations with your team members on the platform. Ensuring everyone has access to the latest information.
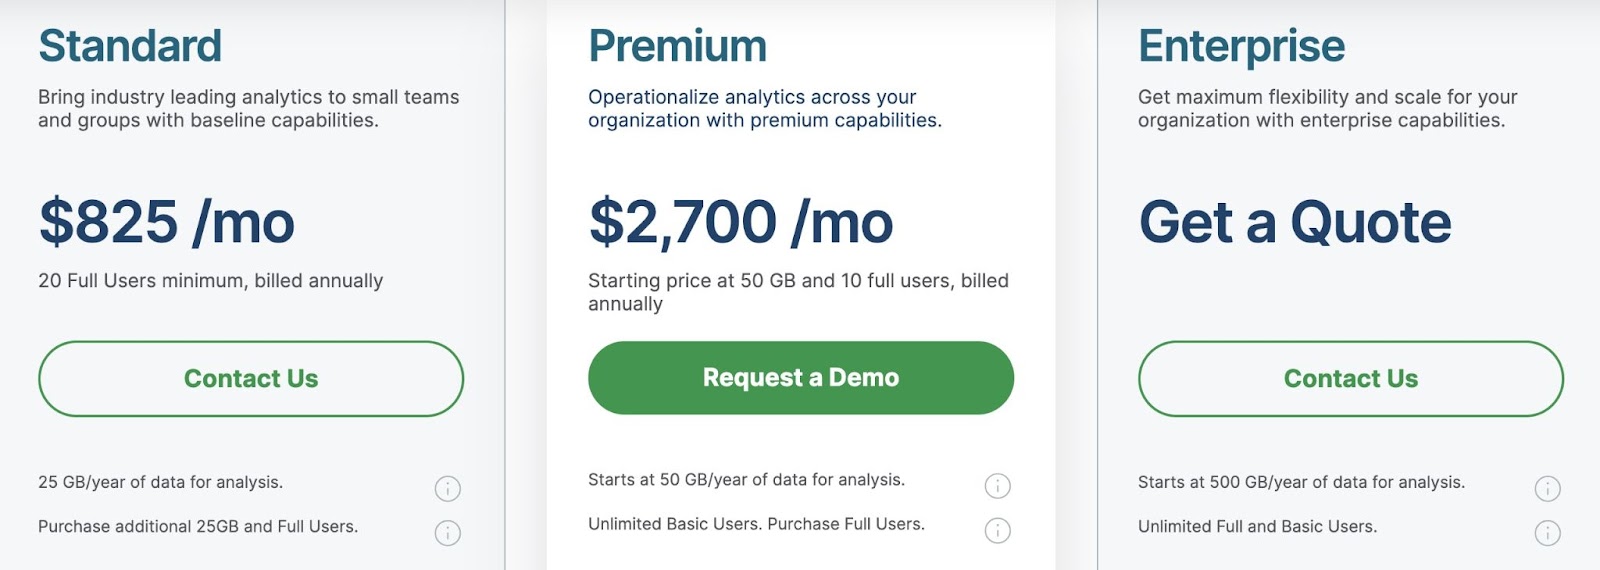
Price: Starts at $825 per month, billed annually
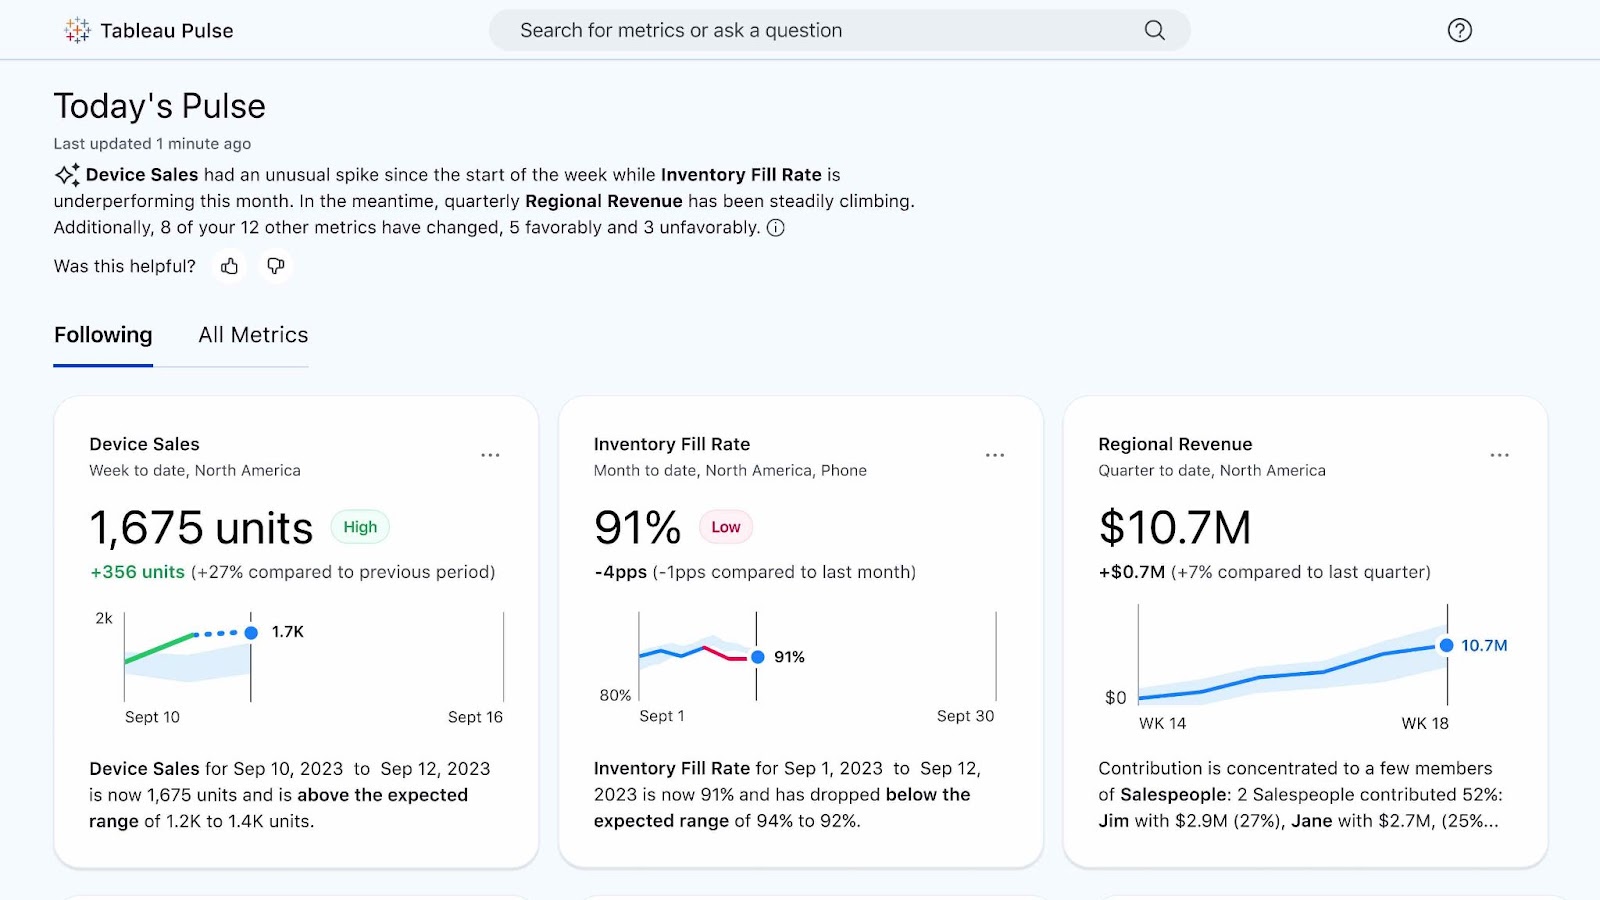
5. Tableau
Owned by Salesforce, Tableau is a well-known data visualization and business analytics tool with “drag-and-drop” data capabilities.
Quickly create and share interactive dashboards, even if you don’t have a technical background. And extract actionable insights from data.
Tableau features include:
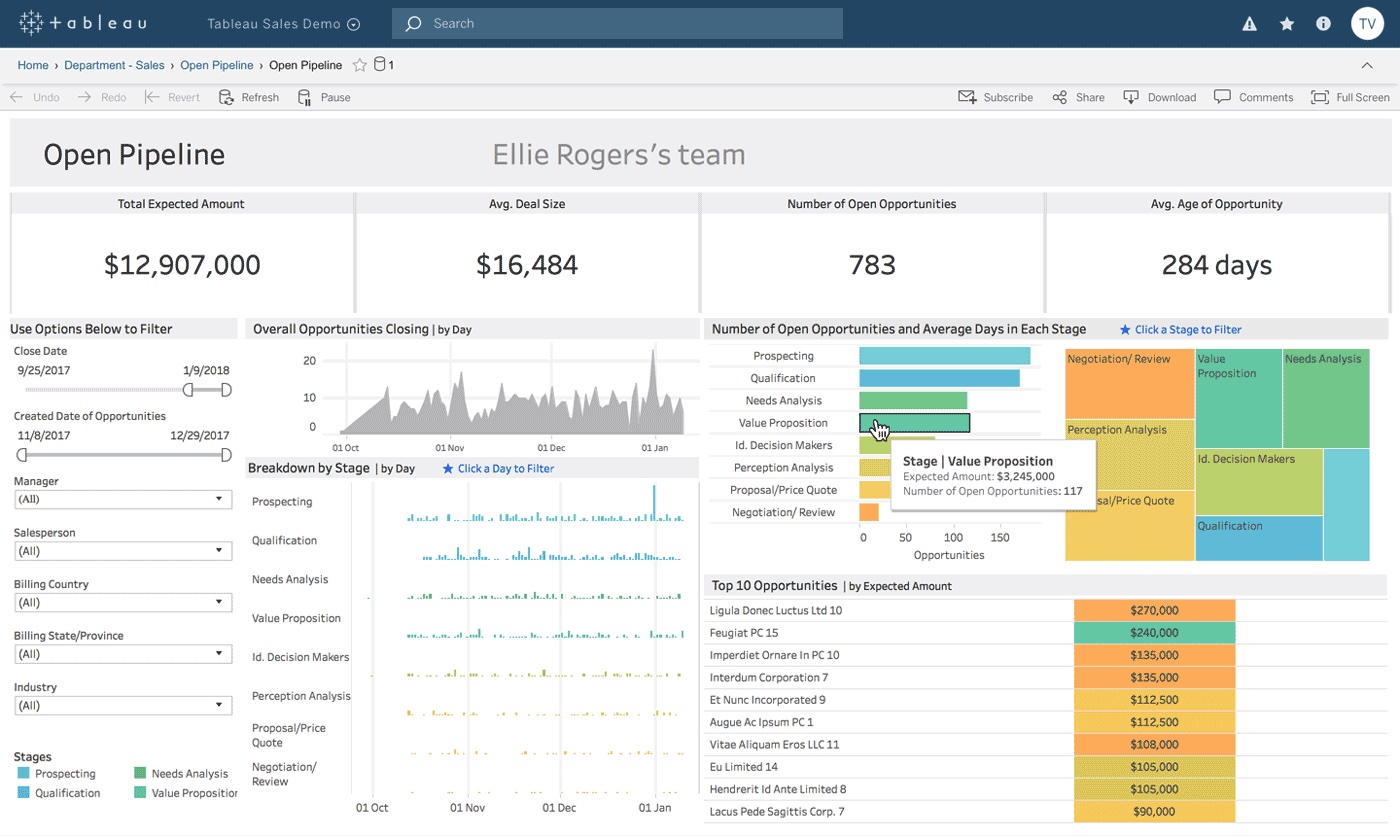
Interactive Reporting
Use Tableau to create interactive charts, graphs, maps, and dashboards. Use these rich data visualizations to track project pipelines, budgets, billable hours, performance, and much more.
Data-Backed Insights
Analyze your data in Tableau using a range of tools and techniques. And find insights and trends that might otherwise go unnoticed.
For example, identify how seasonality impacts your product sales in different markets. Or preemptively stock (or produce) more inventory in response to a sudden spike in sales.
Unified Dashboard
Tableau can connect to a wide range of data sources. Including databases, spreadsheets, cloud services, and more.
Analyze data from multiple sources in one place. And get a comprehensive view of your business.
Scalability
Tableau is designed to handle the needs of large global enterprises. Meaning it can process large amounts of data with minimal downtime or latency.
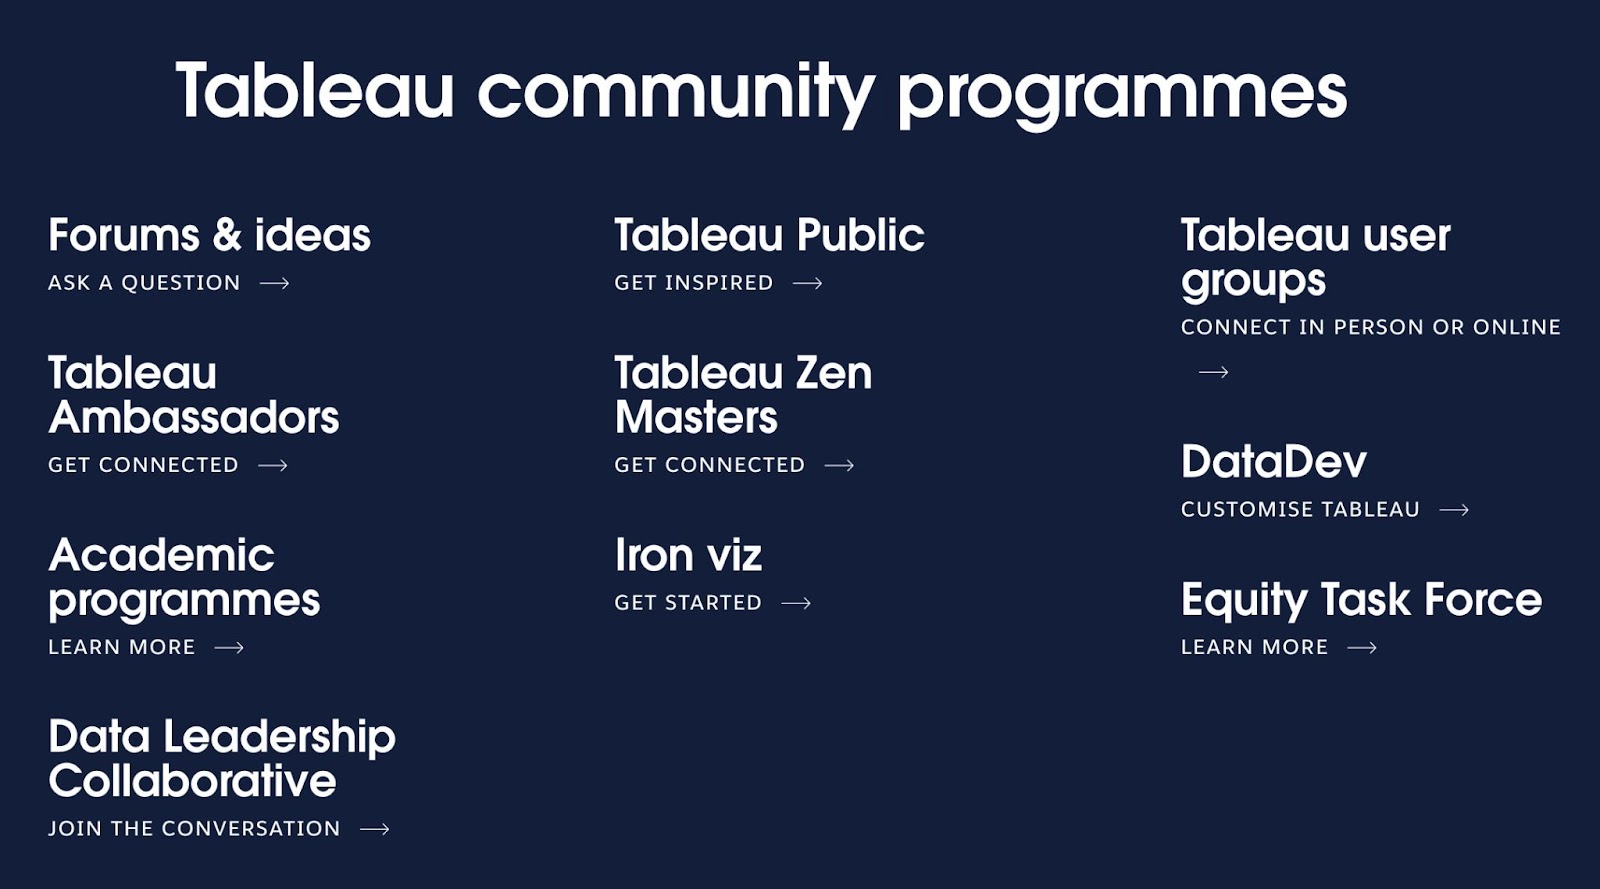
Community and Support
Tableau offers extensive customer support and enablement resources and training. Helping you get the most out of the platform. It also has an engaged global community of users who often share tips, tricks, and best practices.
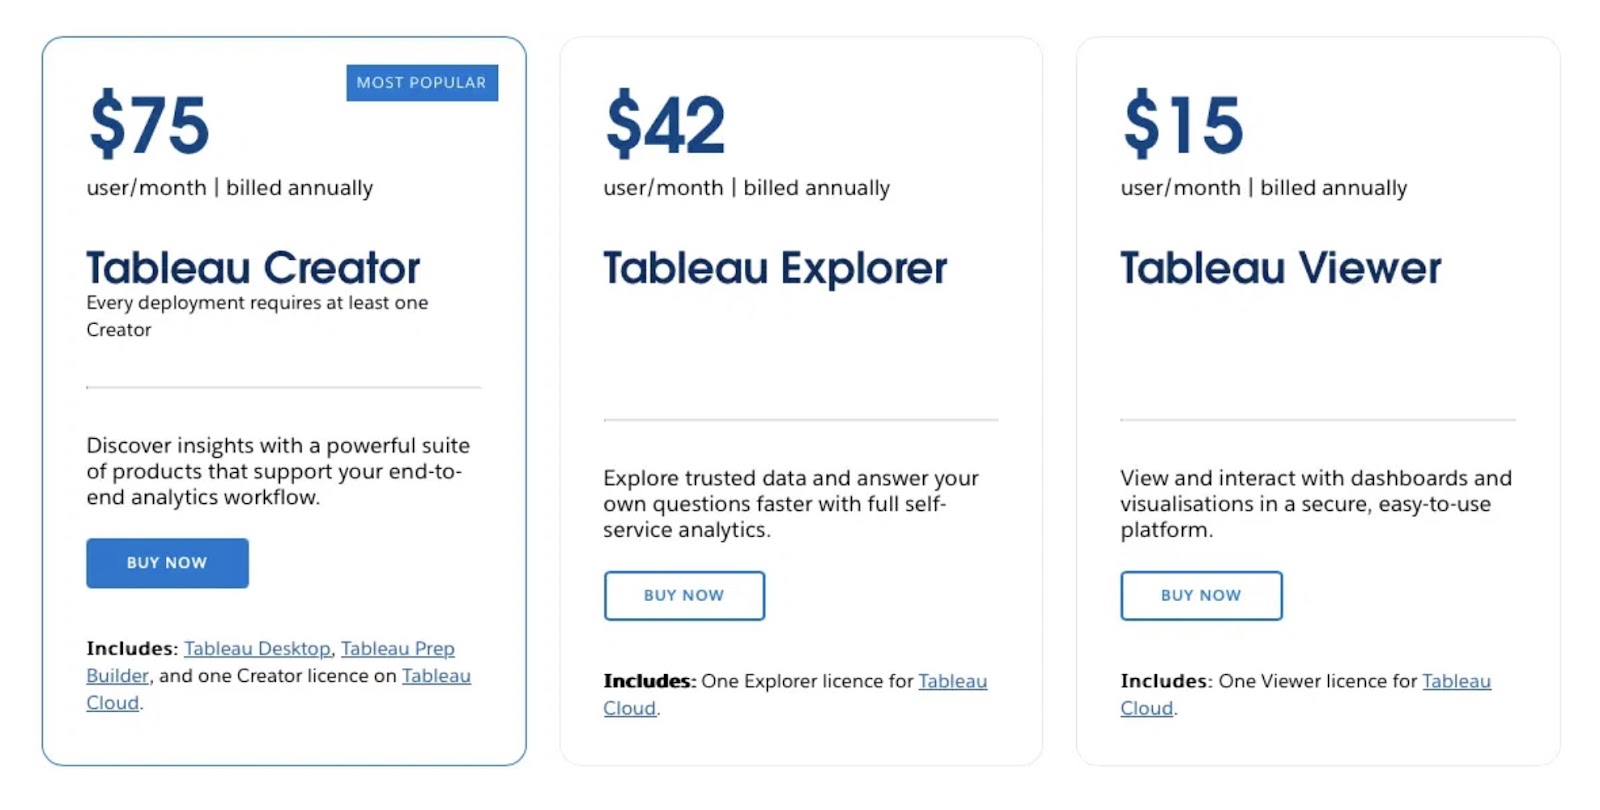
Price: Starts at $15 per month
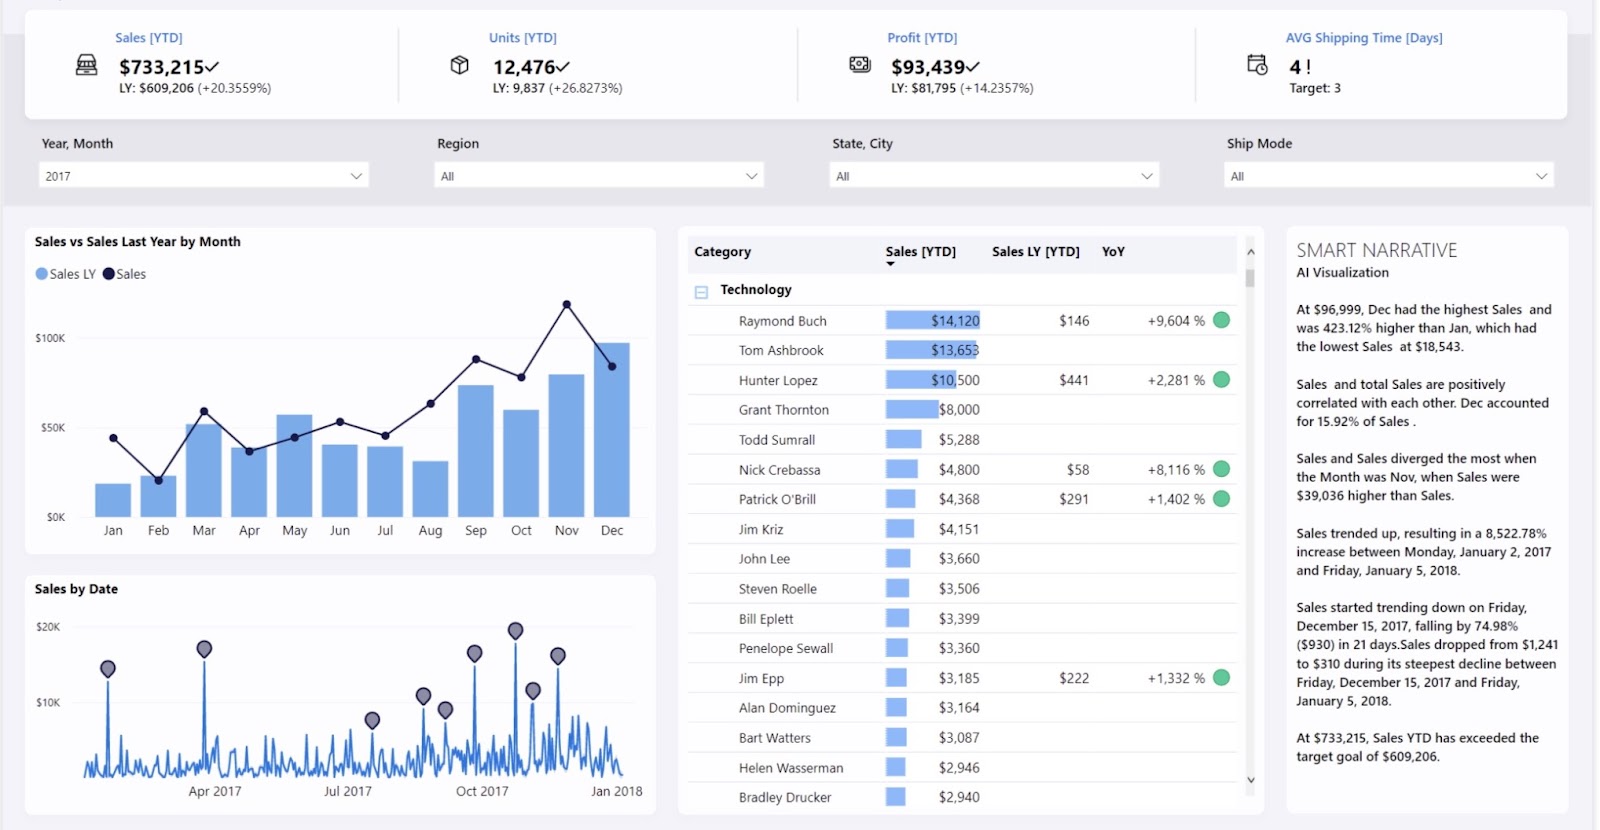
6. Microsoft Power BI
Microsoft Power BI is a user-friendly business intelligence (BI) platform. Its advanced data analytics and data visualization capabilities make it a popular choice.
Power BI features include:
AI-Powered Insights
Using data analysis and AI tools, power BI helps you dig deep into your data.
Enabling you to uncover trends, spot outliers, and answer important questions about your business or project. Such as which potential risks your supply chain may face. And how you can manage that risk.
User-Friendly Reporting
Transform your spreadsheets and numbers into colorful charts, graphs, and maps. Making it easier to understand—and communicate—the story your data is telling.
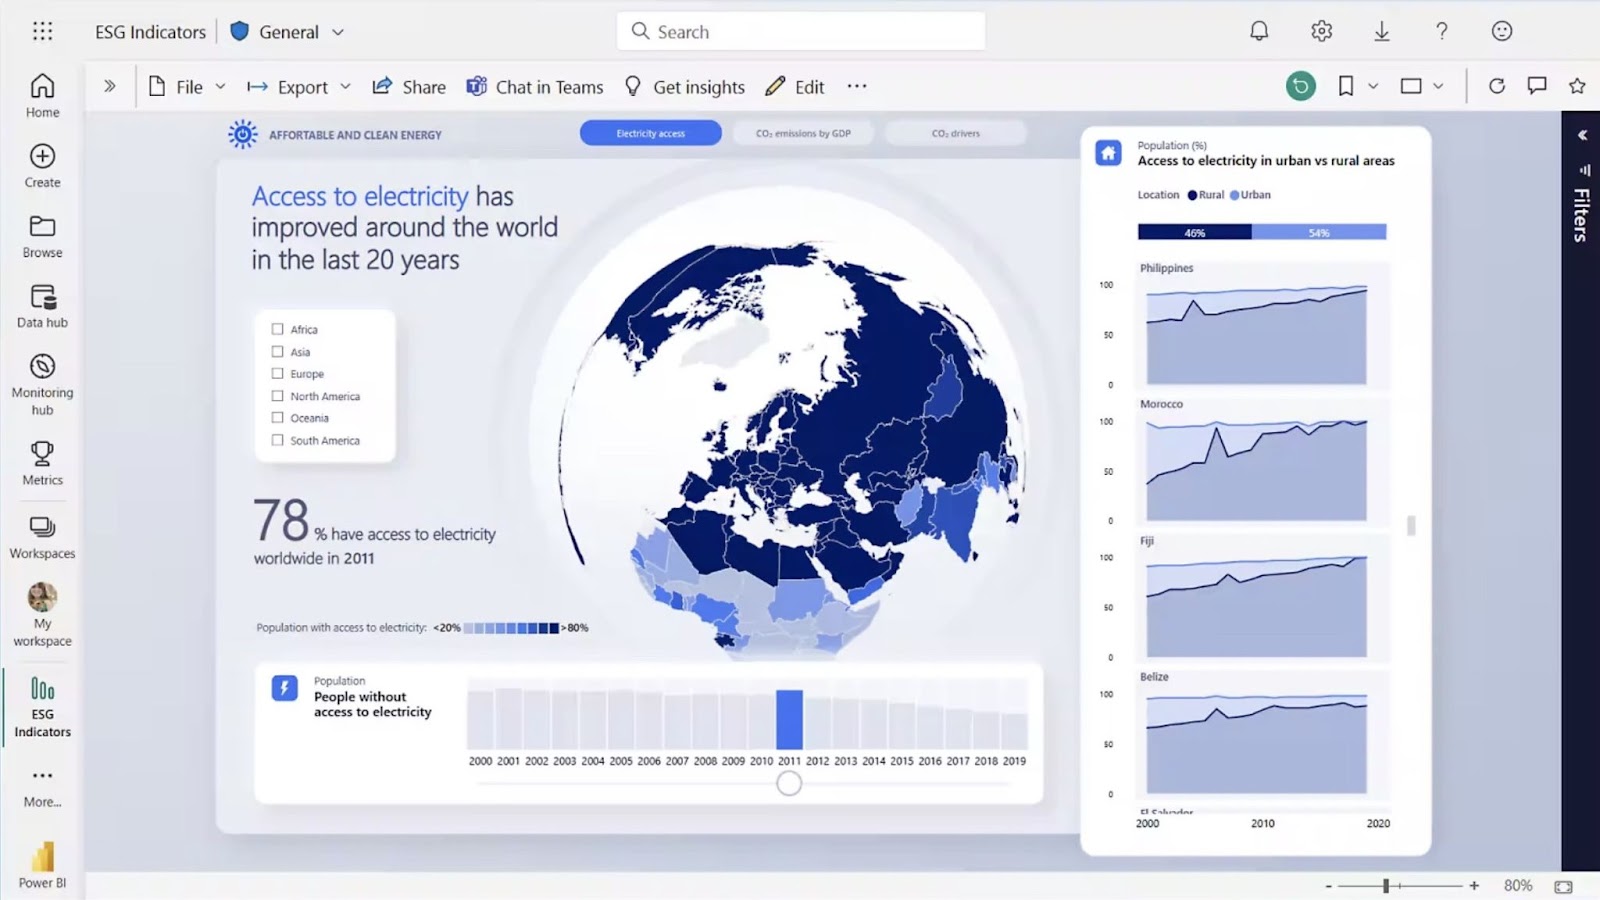
Interactive Dashboards
Create interactive dashboards that give you real-time updates on key metrics. This lets you track what’s happening in your business at a glance. Such as the latest sales figures and forecasts.
Report Embedding and Sharing
Easily embed and share your reports and dashboards with your organization or external partners.
This ensures everyone has access to important business data. Like which product categories have the fastest-growing conversion rates.
Tool Integration
Microsoft Power BI seamlessly integrates with other Microsoft products. Like Excel and SharePoint.
It also supports integrations with a long list of third-party tools and apps. Making it easy to include data from various sources in your queries. For more comprehensive data analyses.
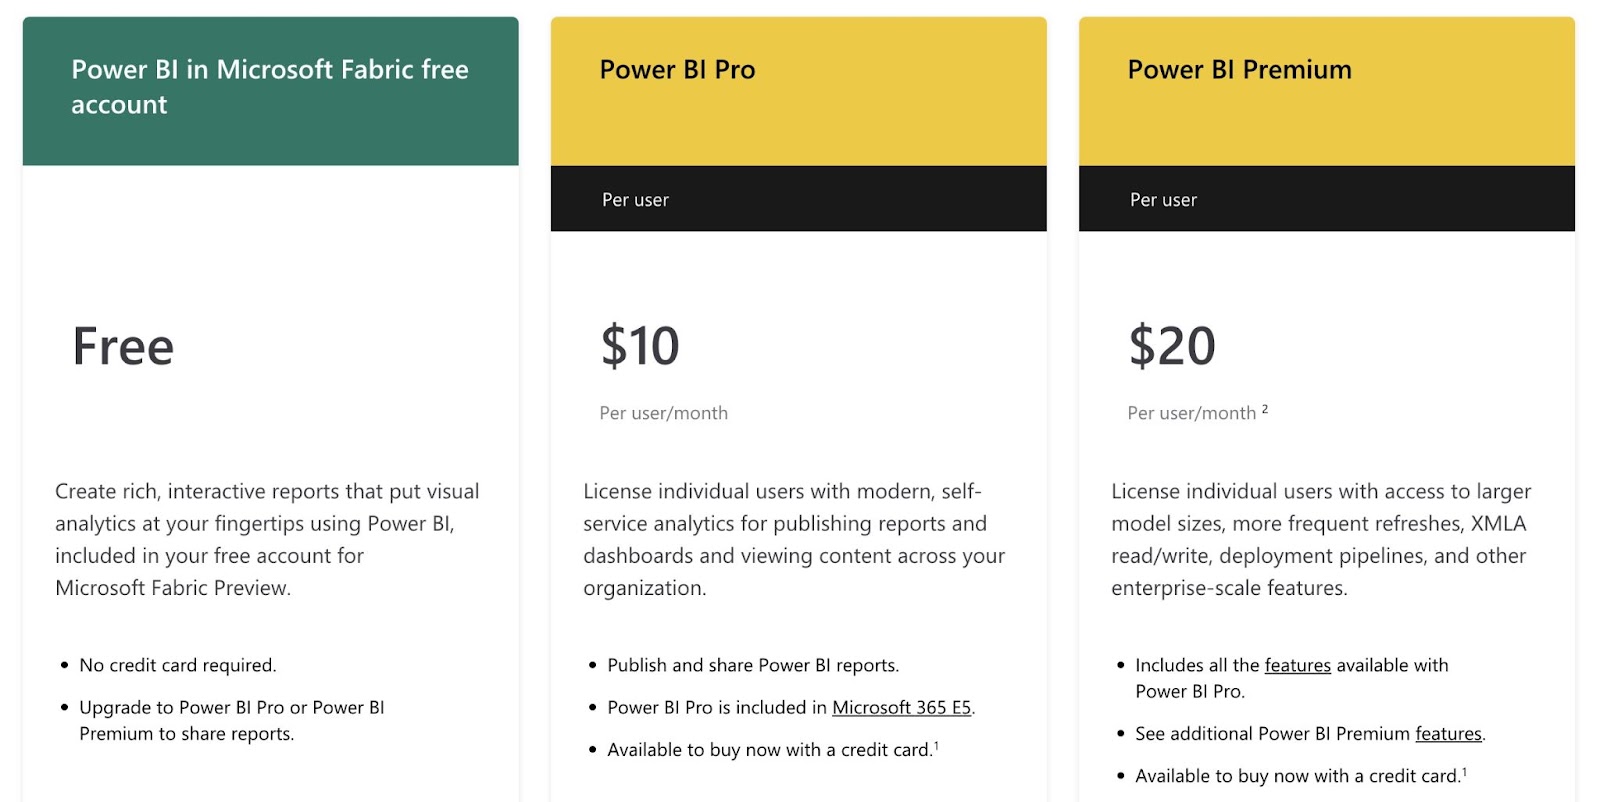
Price: Starts at $10 per month. A free version is available with a Microsoft Fabric account.
7. SAP Analytics Cloud
SAP Analytics Cloud is a holistic cloud-based analytics solution for enterprises. SAP is a well-known enterprise resource planning (ERP) software provider.
SAP Analytics Cloud features include:
Business Intelligence
SAP Analytics Cloud can help you make better business decisions. The tool collects data from various sources like spreadsheets or databases. And turns it into easy-to-understand visualizations. Such as charts and graphs.
SAP Analytics Cloud goes beyond just showing you what happened in the past. Using advanced algorithms, it predicts future trends and outcomes based on historical data. This can help you anticipate challenges and opportunities before they arise.
For instance, if you run an ecommerce store, SAP might recommend hiring additional order fulfillment staff during periods that have historically seen spikes in orders.
Planning and Forecasting
Use SAP Analytics Cloud to create budgets, forecasts, and plans. Collaborate on planning processes and make adjustments in real time.
Simulate scenarios or “Stories” to test hypotheses and see how specific conditions might affect your outcomes. And make data-driven decisions to mitigate risk.
For instance, you might run a scenario to see how a product recall in a specific market would impact your bottom line. And how much revenue you could lose from reputational damage.
Integration with SAP Systems
SAP Analytics Cloud seamlessly integrates with other SAP systems. Like SAP ERP or SAP S/4HANA. As well as with non-SAP systems.
This ensures you can access and analyze all your data in one place.
Security and Compliance
SAP Analytics Cloud prioritizes data security and compliance. Strict protocols protect sensitive information and ensure regulatory compliance.
This is especially important if your business operates in a highly regulated industry (such as healthcare or finance) or geographic region (such as the EU).
Price: Pricing available on request. Minimum five users.
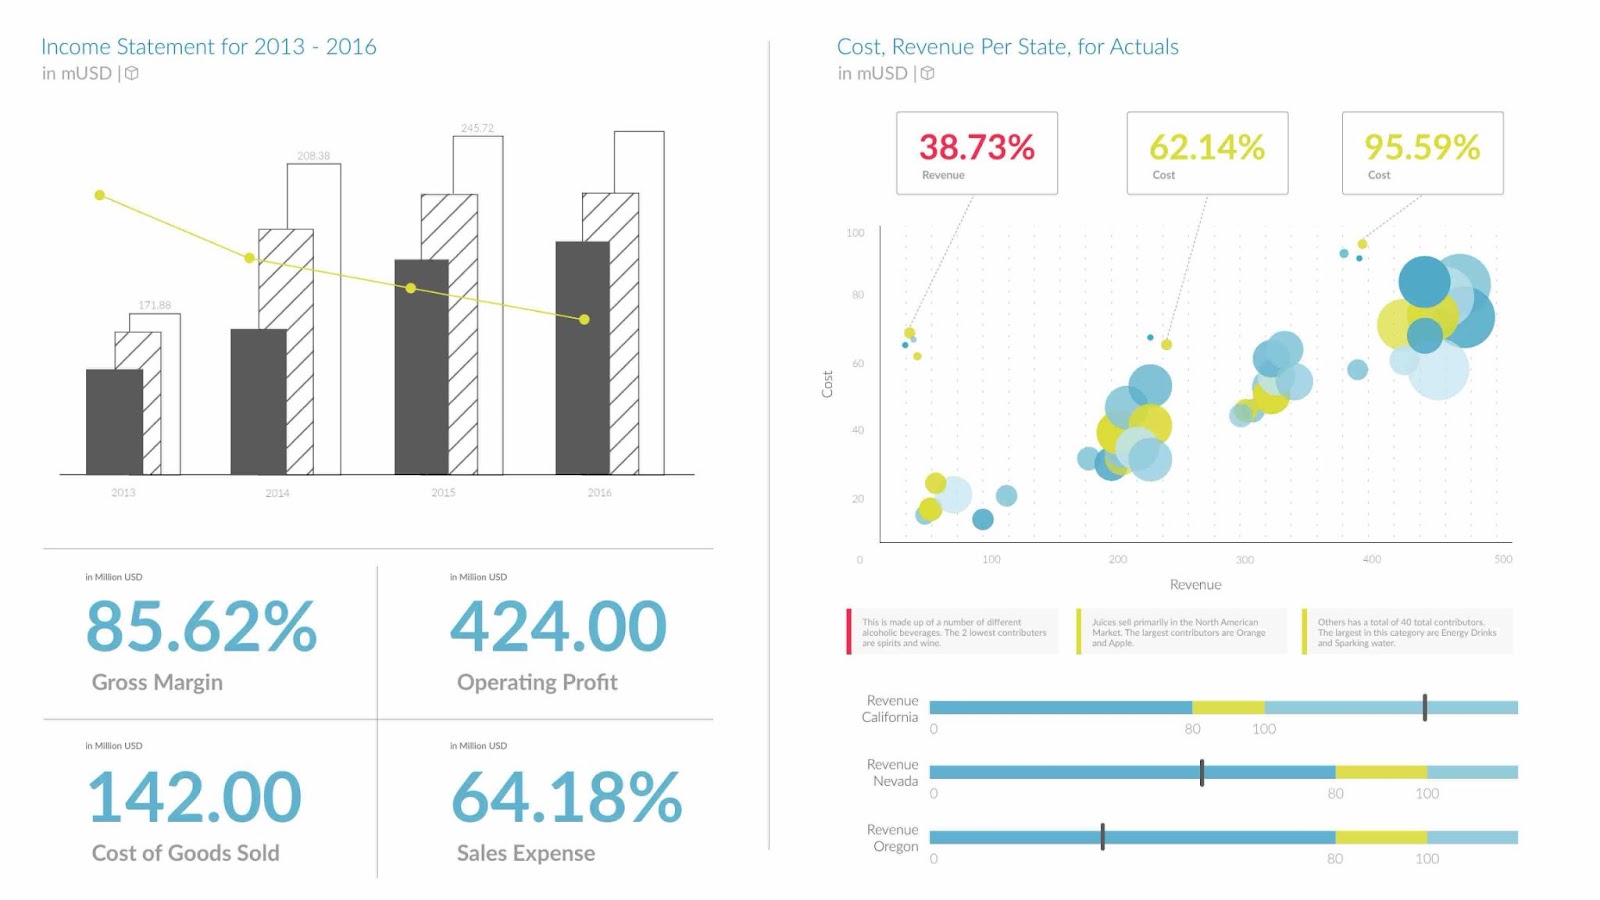
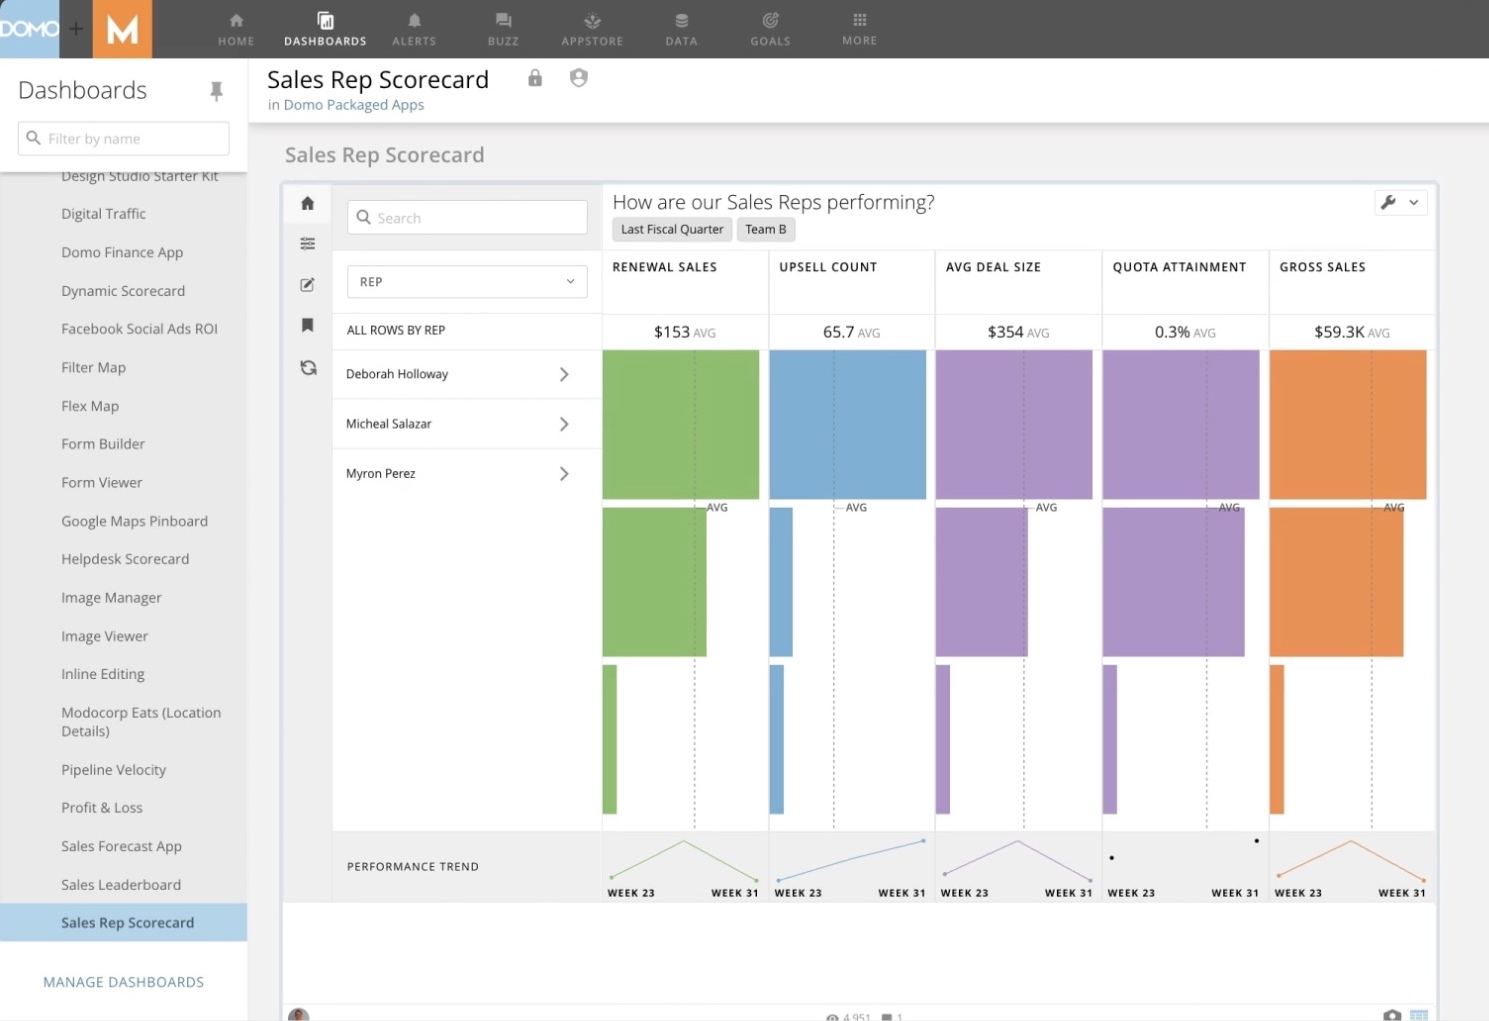
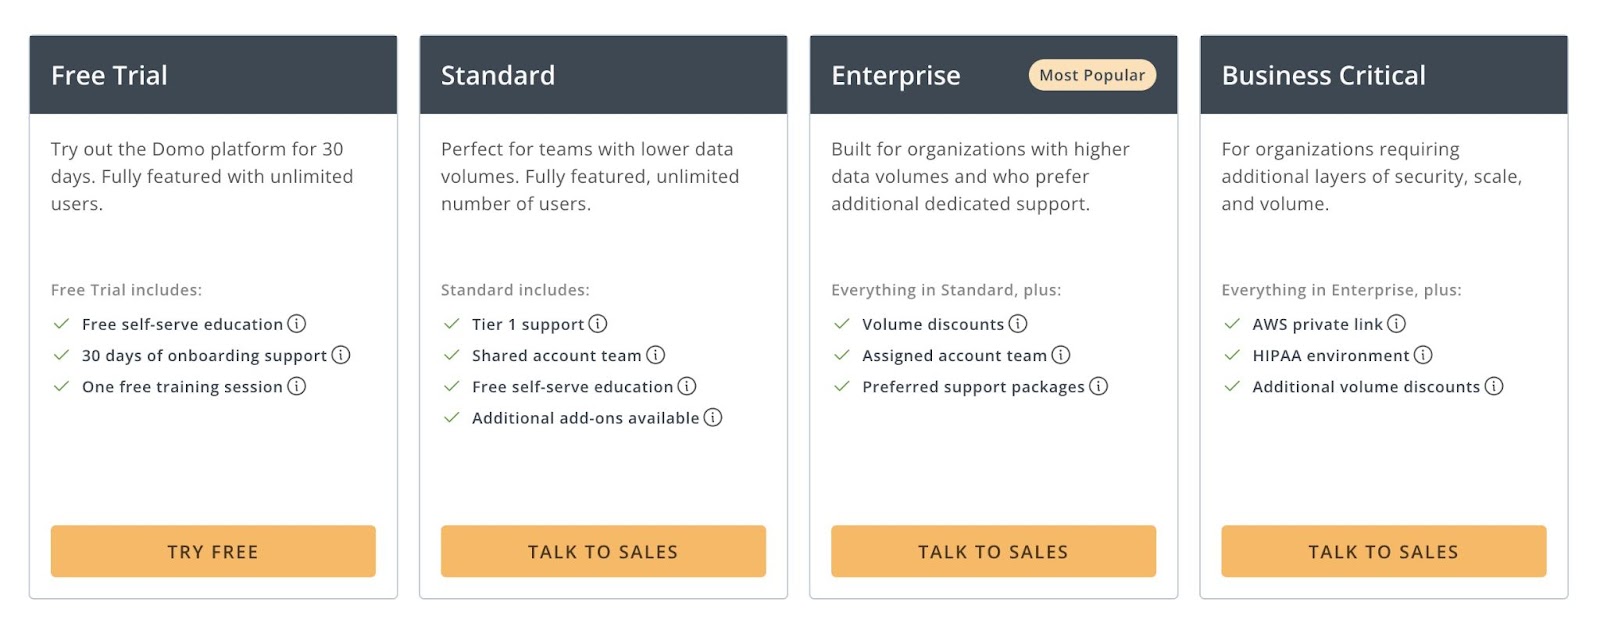
8. Domo
Domo is a cloud-based BI and analytics platform that extracts actionable insights from your business data.
Domo features include:
Personalized Notifications
Domo offers data updates and alerts. So you can track key performance indicators (KPIs) in real time. Enabling you to make decisions using the most up-to-date information.
For example, you might set an alert to inform you when stock levels drop below a certain point. Or track your marketing budget in real-time and pause your campaign when you hit your spend limit.
Data Storytelling
Domo’s powerful visualization features allow you to quickly create interactive charts, graphs, and dashboards. Understand complex information at a glance and rapidly spot patterns and outliers in your data.
Track progress towards your sales quotas, reward top performers, and identify underperforming salespersons. So you can help them meet their goals.
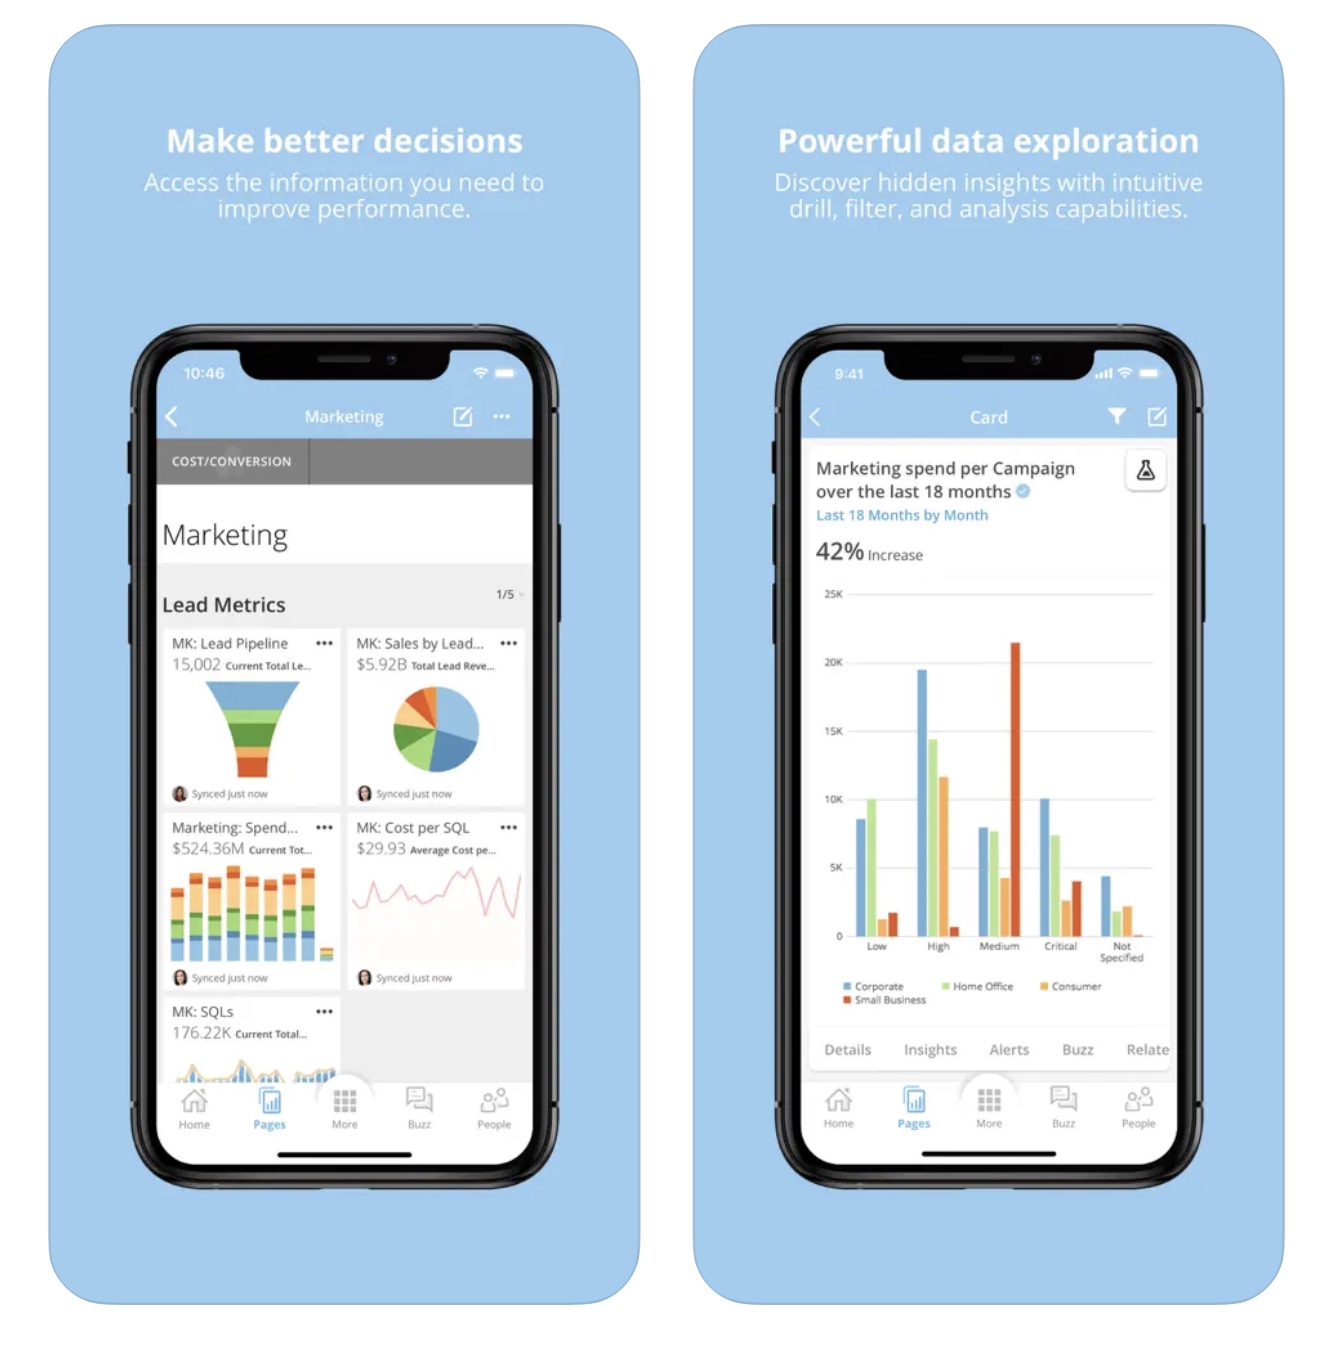
Custom Apps
Use Domo’s low-code app creation tools to rapidly create your own mobile apps to analyze data and automate tasks.
Let decision-makers access critical information anywhere, any time. For example, by giving front-line workers access to up-to-date inventory data.
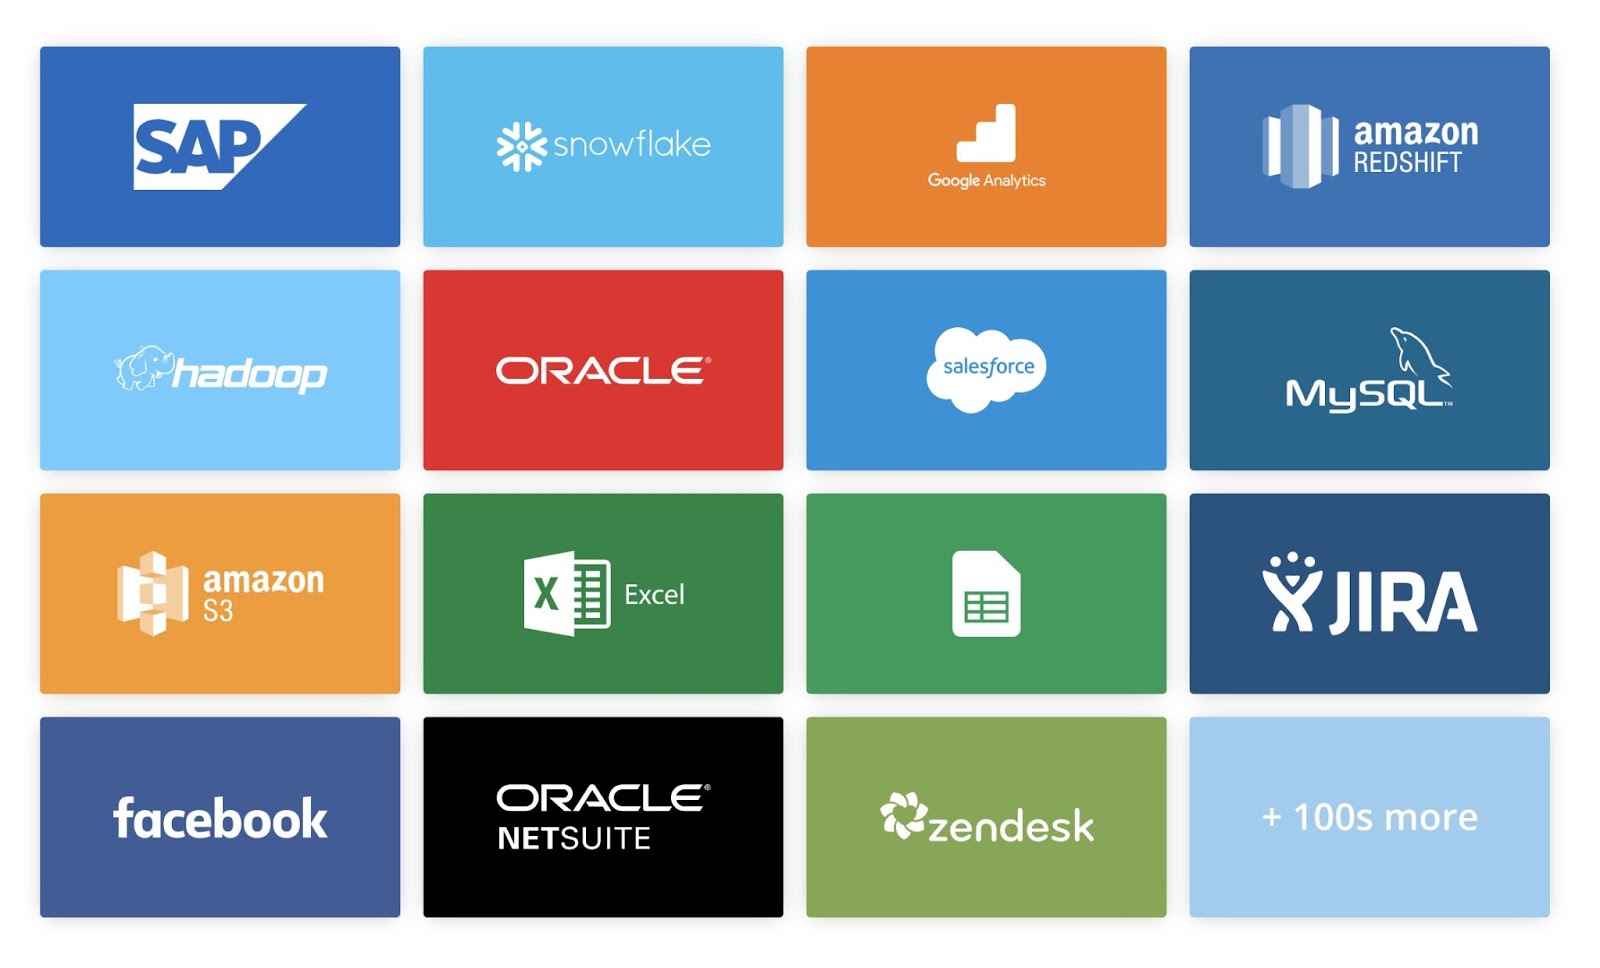
Dynamic Integration
Domo connects to 1,000+ data sources. Including databases, spreadsheets, and cloud applications.
This lets you view all of your organization’s data in one place for deeper insights.
Price: Usage-based. Free plan comes with 300 credits.
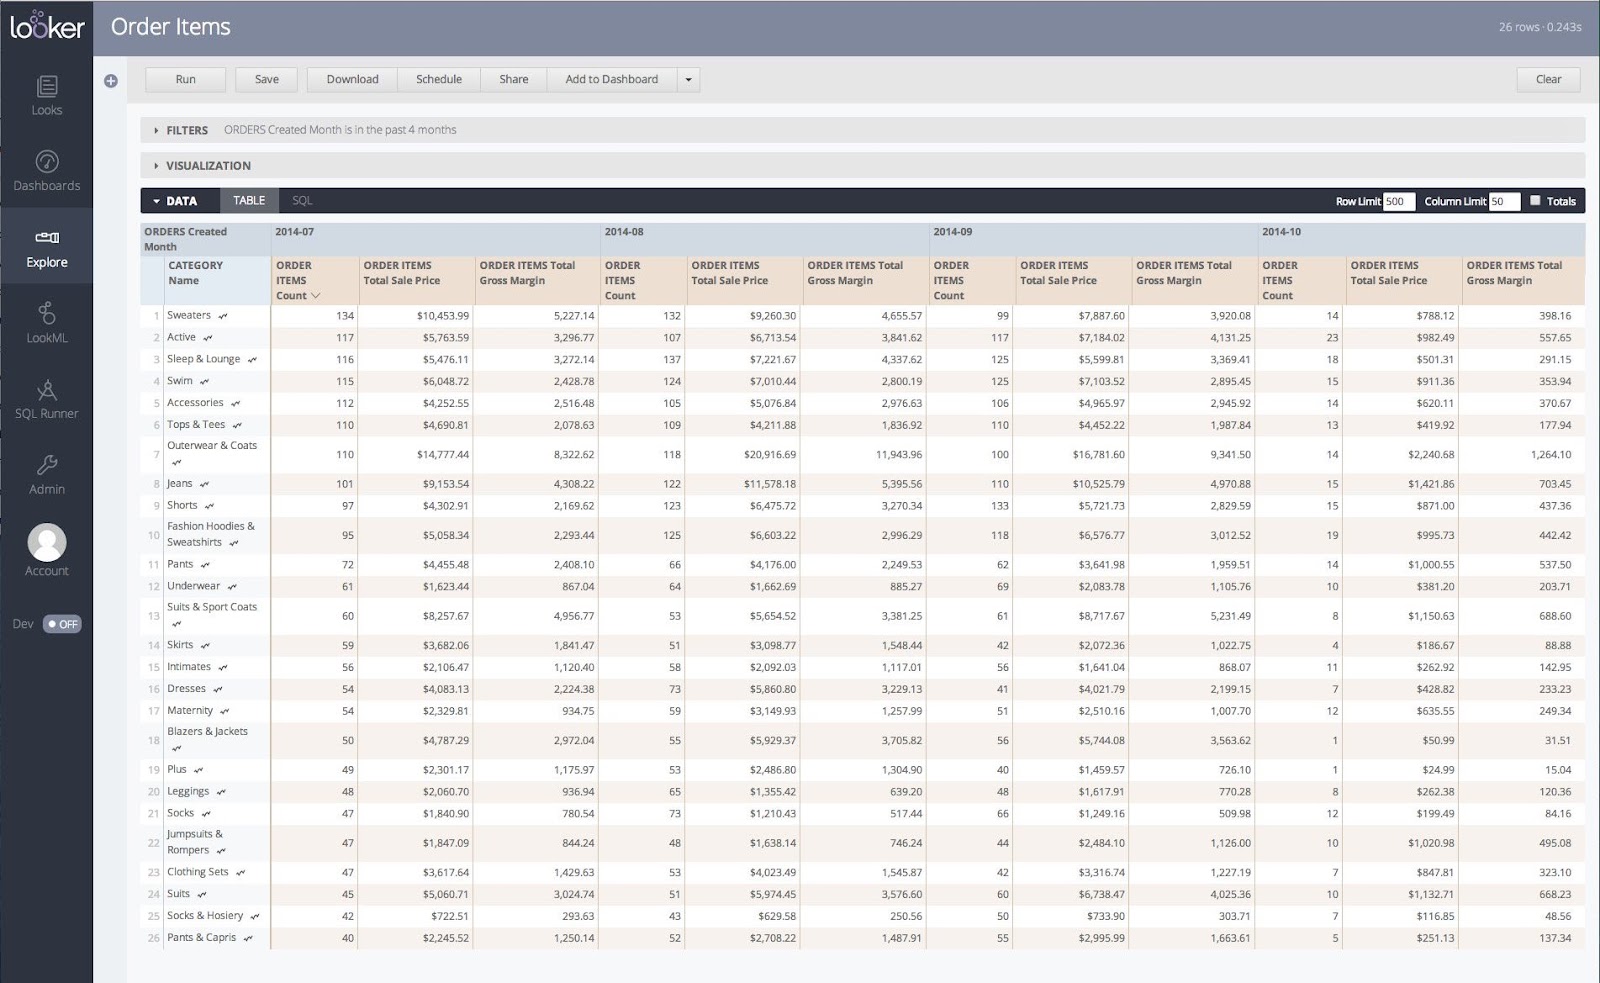
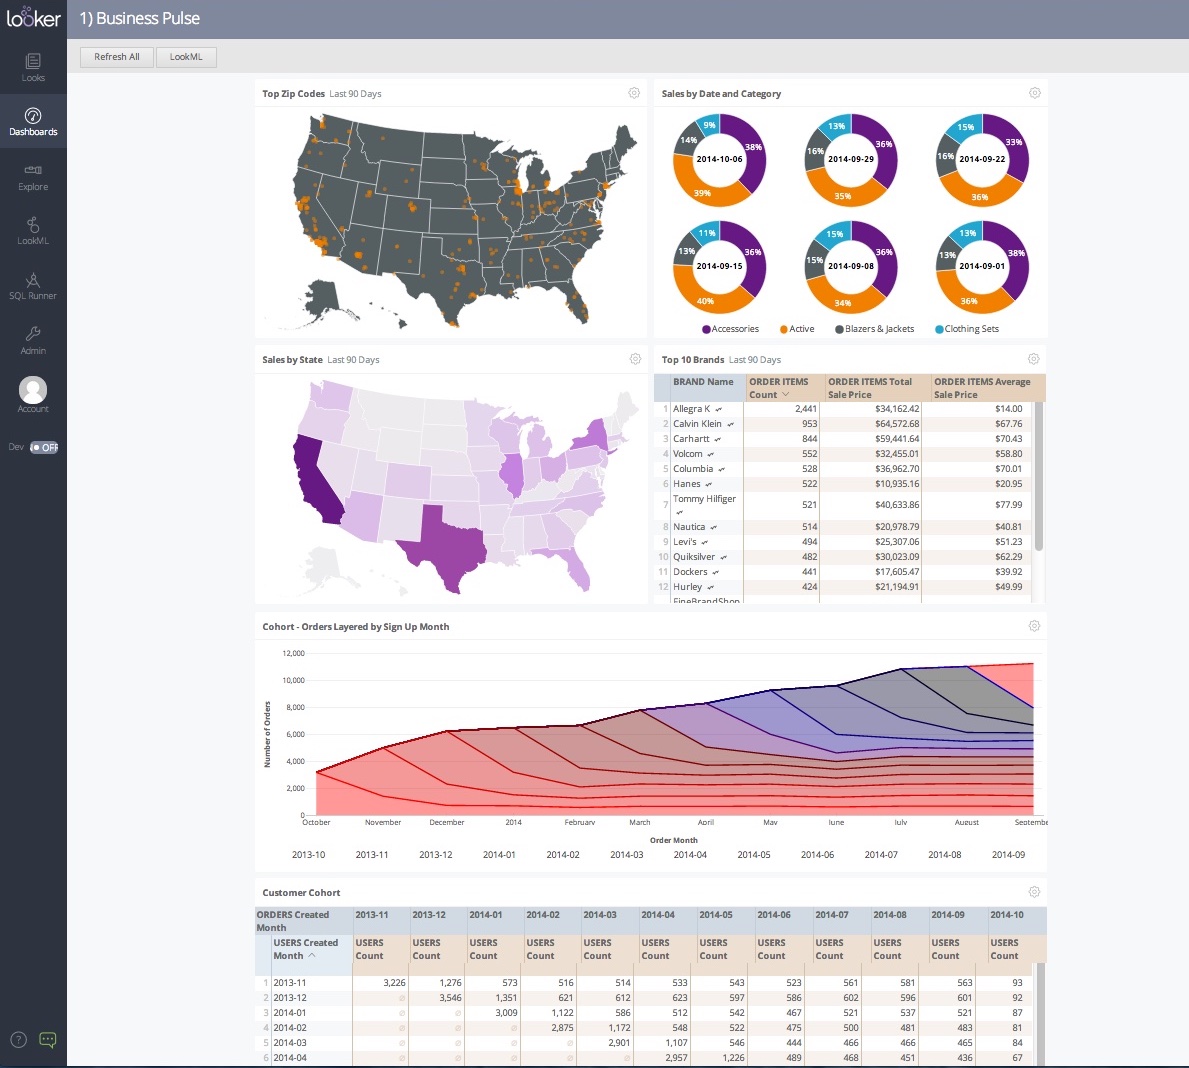
9. Looker
Looker is a cloud-based data analytics and business intelligence platform by Google. It allows you to explore, analyze, and share insights from your data.
Looker features include:
Data Modeling
Looker offers powerful data modeling capabilities. Define relationships, calculations, and metrics within your data. Ensuring consistent and accurate analysis across your organization.
Embedded Analytics
Looker can be embedded directly into other applications and workflows. Easily access data and insights in the context of your daily work. And apply your analytics insights in your decision-making processes.
Customizable Reporting
Looker offers various data visualization options. Including charts, graphs, and dashboards Making data easier to understand and communicate with others. Customize these visualizations to suit the needs of different stakeholders.
Scalability
Looker’s cloud-based architecture means it can scale with your business. Enabling rapid analytics deployment and management.
Price: Pricing available on request.
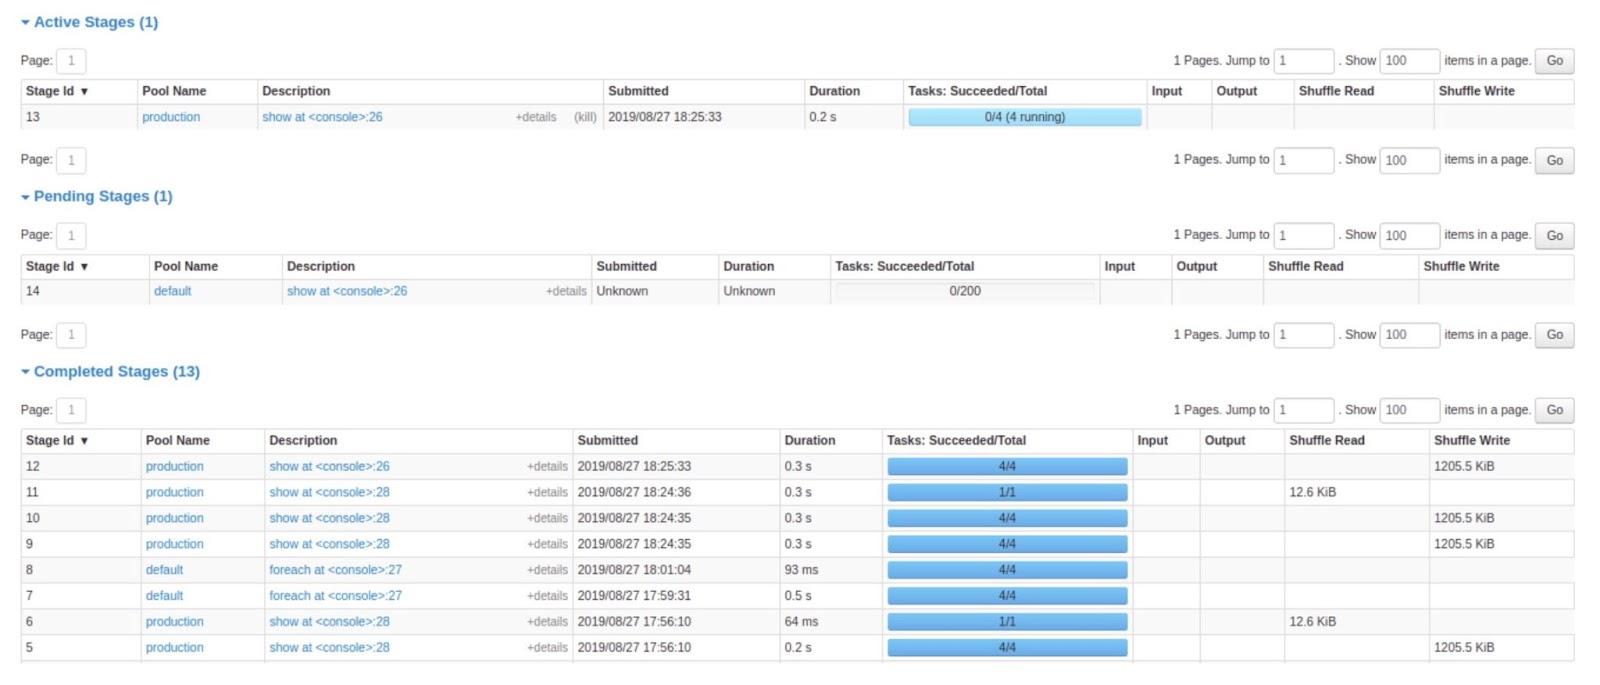
10. Apache Spark
Apache Spark is an open-source distributed computing system for big data processing and analytics. If your business has data scientists and application developers who analyze datasets at scale, you might consider this tool.
Apache Spark’s features include:
Data Processing
Apache Spark enables you to perform numerous data processing tasks in a single framework. Including batch processing, real-time streaming, machine learning, and interactive queries.
Big Data Capabilities
Spark is widely used for batch processing of large datasets. It can handle complex data processing tasks. And transform large volumes of data efficiently and quickly.
Programming Language Compatibility
Apache Spark is compatible with several popular programming languages. Including Java, Scala, Python, and R.
Fault Tolerance
Spark can recover lost data and continue processing it without interruption. This is because it distributes and tracks datasets across many computers.
Big Data Integrations
Apache Spark integrates with various big data ecosystems, including Hadoop, Apache HBase, Apache Hive, and Apache Kafka.
This means most Spark users can use it with their existing data infrastructure without additional costs.
Price: Free (opensource)
When deciding which analytics tools you want to use, it can be helpful to understand the types.
Descriptive Analytics Tools
Descriptive analytics tools analyze and summarize historical data to help you understand past trends, changes, and patterns.
Descriptive analytics tools answer questions like “What happened?” and “How did it happen?”
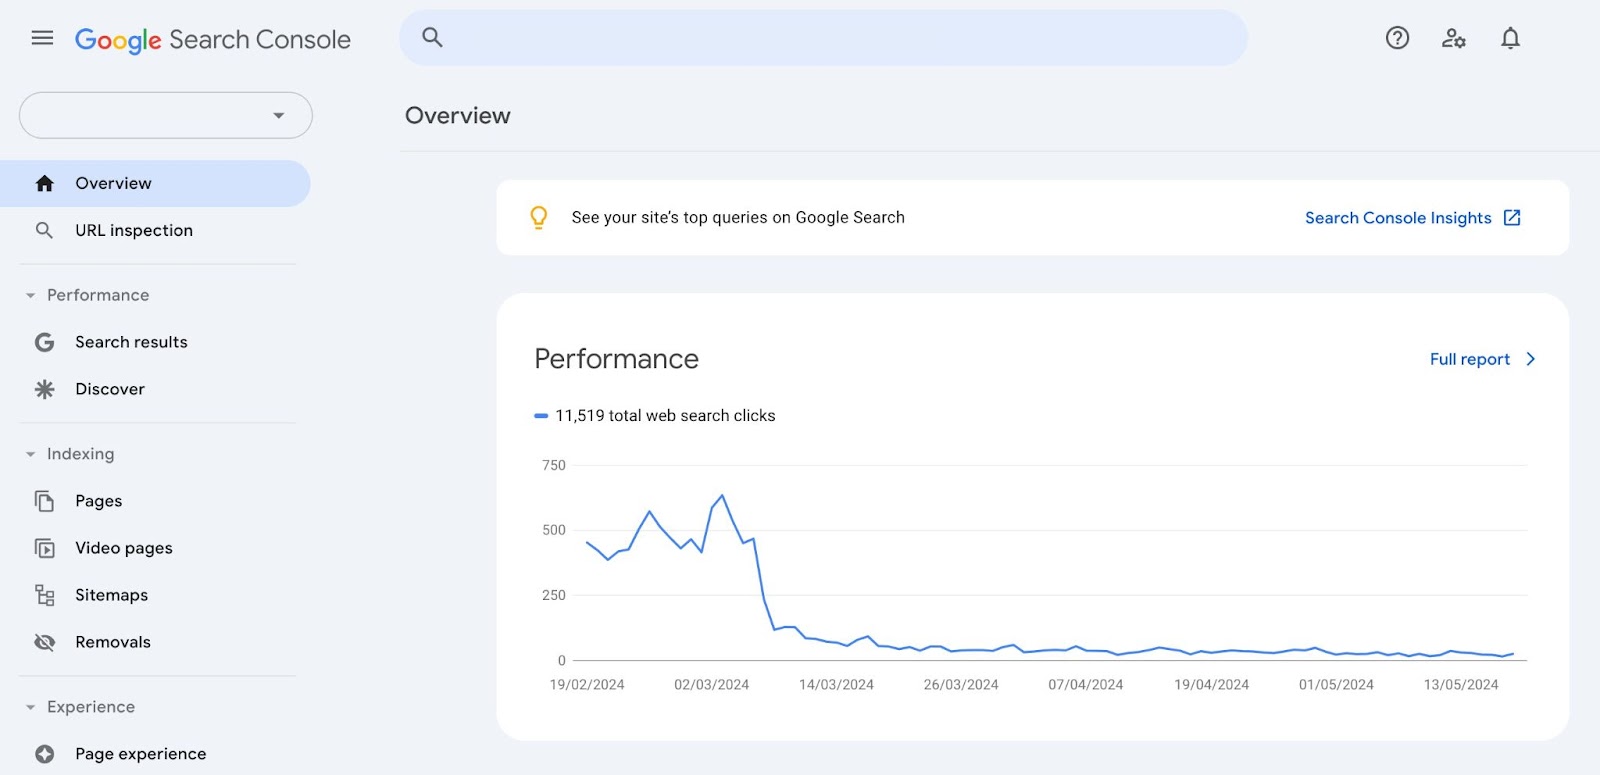
Example: Google Search Console
Google Search Console provides insights into website traffic, performance data, and website performance issues.
It summarizes historical data to show trends over time. Helping website owners understand what happened on their site in the past.
Diagnostic Analytics Tools
Diagnostic analytics tools help you figure out why something happened in the past by analyzing data and identifying correlations or relationships between different variables.
Diagnostic analytics answers questions like “Why did it happen?” and “What are the contributing factors?”
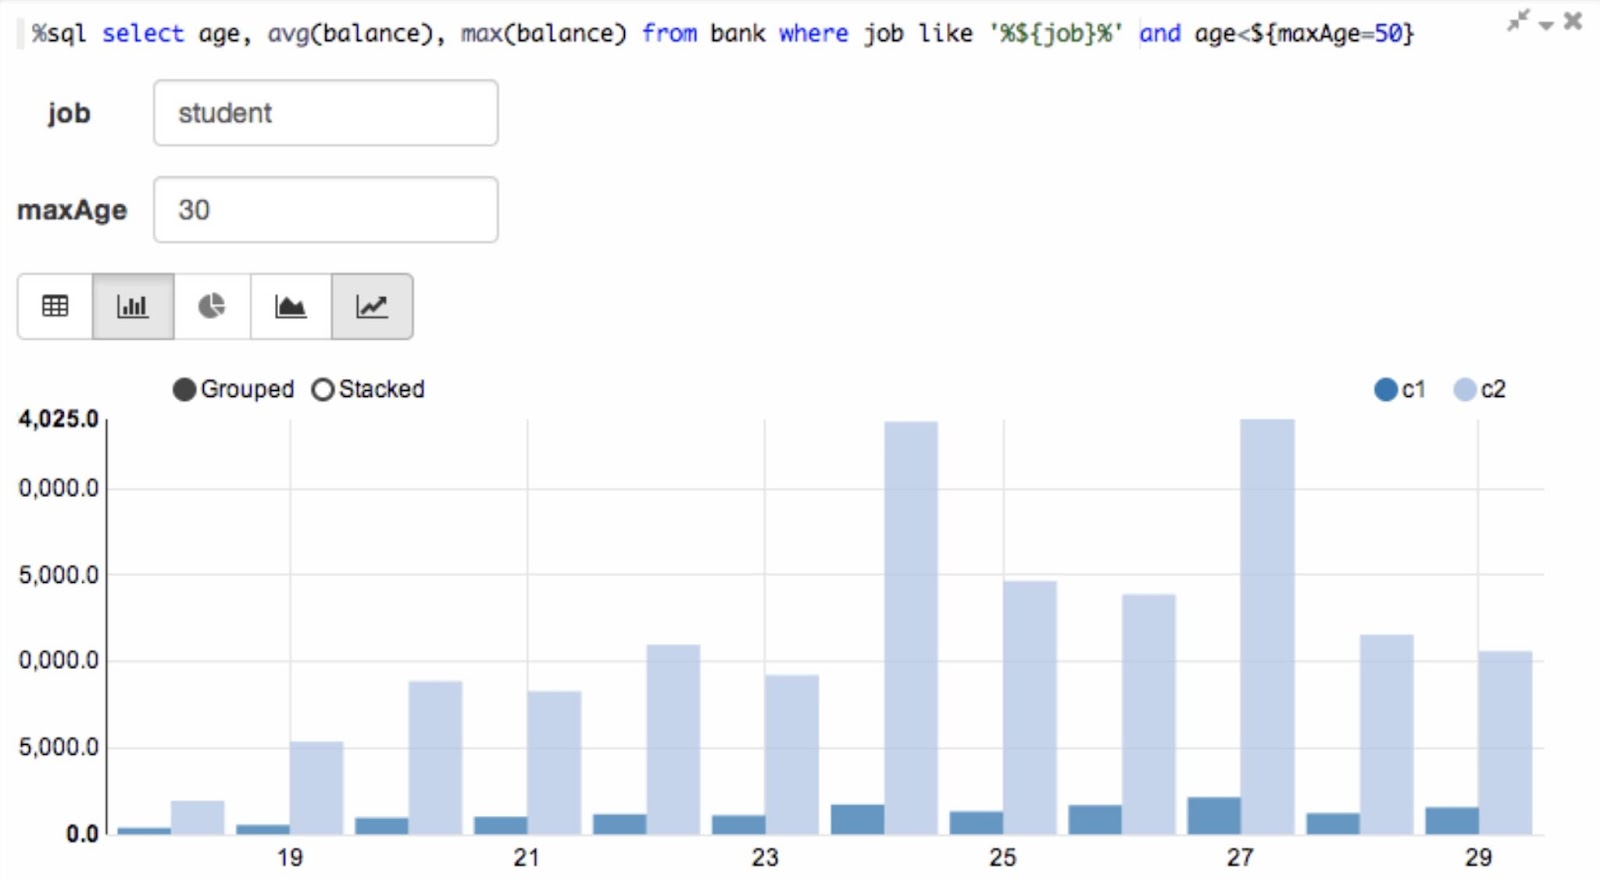
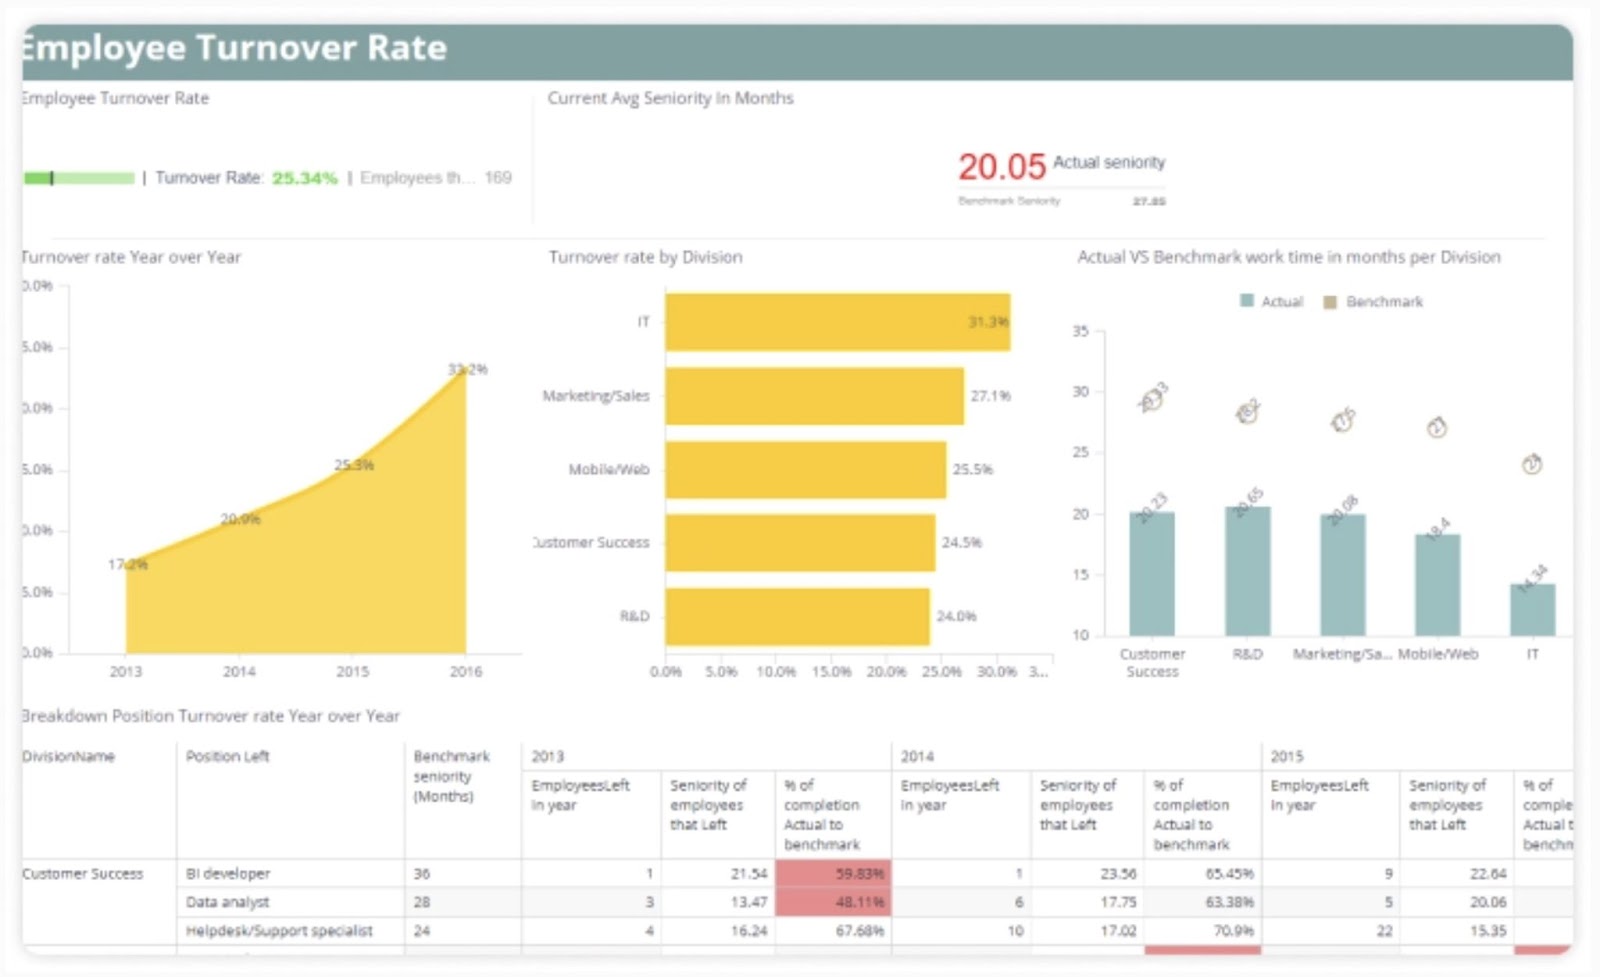
Example: Sisense
Sisense is a business intelligence platform that enables organizations to analyze data to uncover the reasons behind certain trends or events.
For example, an HR leader might use Sisense’s Human Resources dashboard to investigate why a department’s employee turnover is much higher than the company’s average turnover.
Predictive Analytics Tools
Predictive analytics tools help you predict what might happen in the future. They use statistical models to forecast future outcomes or trends based on patterns in historical data.
Predictive analytics answers questions like “What is likely to happen?” and “What might be the future impact?”
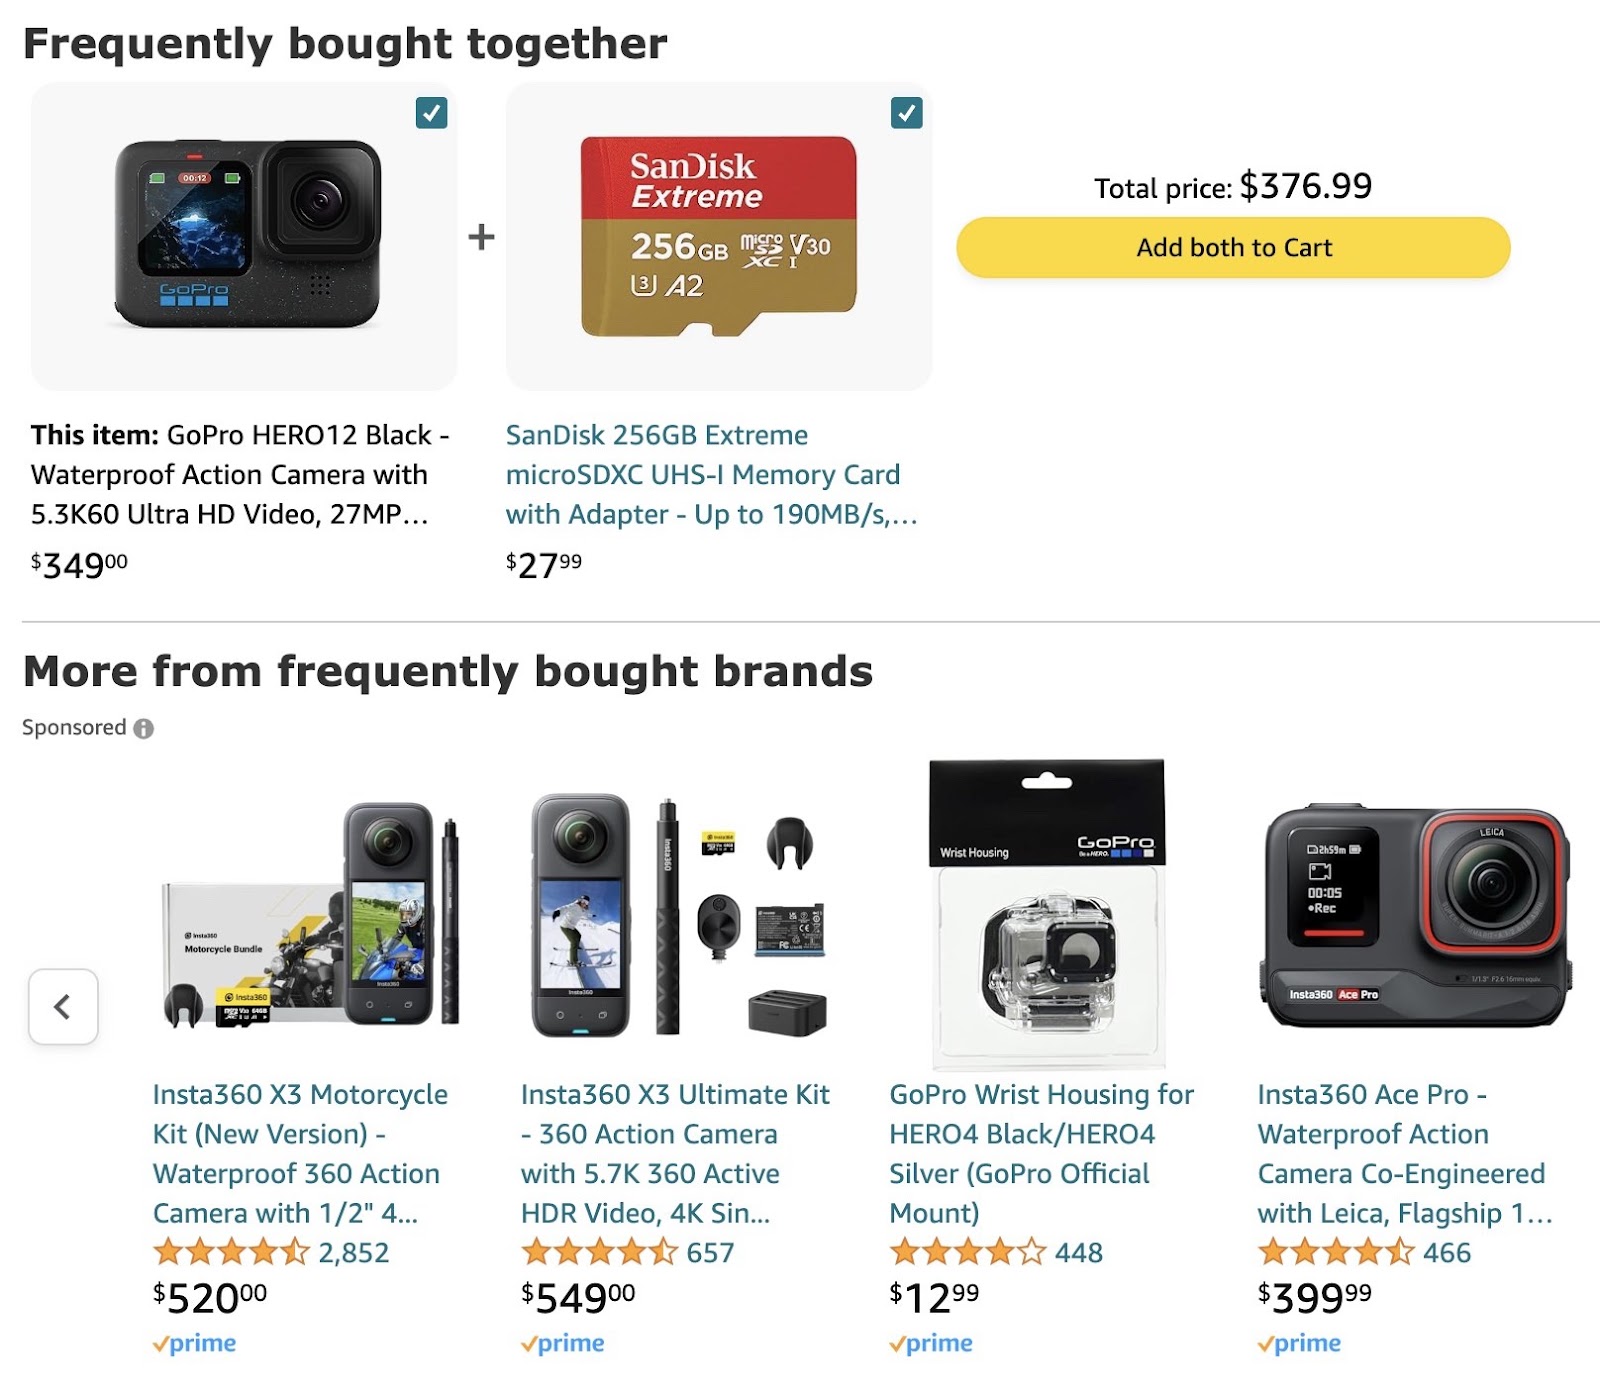
Example: Amazon’s recommendation system
Amazon uses predictive analytics to recommend products to customers. Based on their past purchase history and browsing behavior.
Amazon can predict which products a customer might be interested in purchasing next by analyzing patterns in data. Such as which products are frequently bought together. Or which items are popular among similar customer profiles.
Prescriptive Analytics Tools
Prescriptive analytics tools help you determine what actions to take to achieve a desired outcome by providing actionable insights and recommendations.
By combining historical data, predictive models, and optimization techniques to recommend specific actions or decisions, prescriptive analytics answers questions like “What should we do?” and “How can we achieve our goals?”
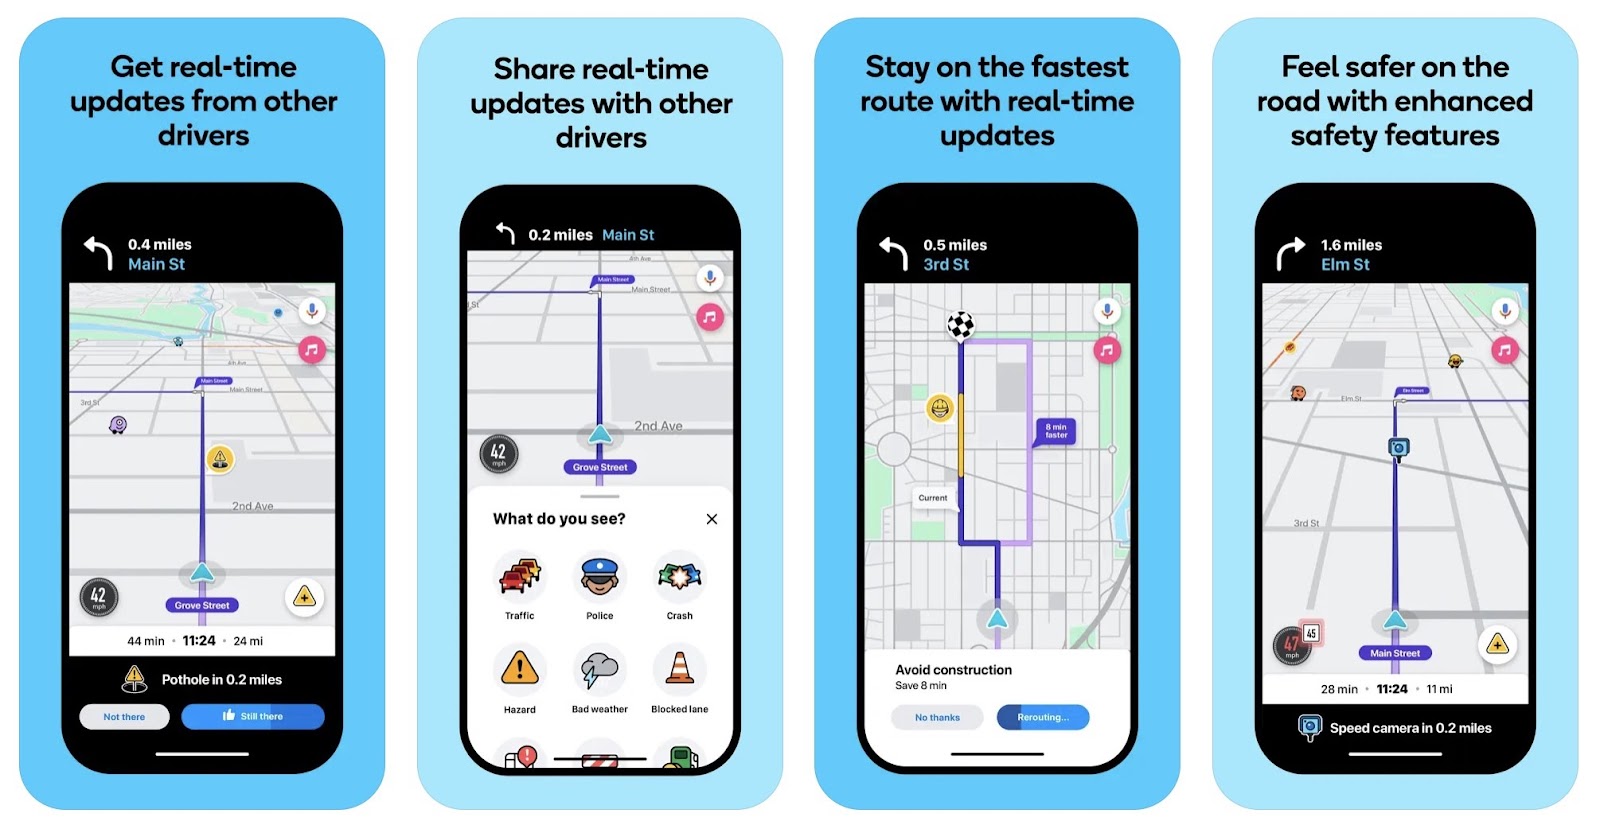
Example: Waze navigation app
Waze uses prescriptive analytics to recommend the best routes for drivers to take based on real-time traffic data, road conditions, and historical traffic patterns.
Waze can suggest the fastest route to a destination based on data. Helping drivers avoid traffic jams and save time on their commute.
Use these strategies to successfully integrate analytics tools into your business processes. Ensuring team adoption and analytics success.
Define Clear Objectives
Start by identifying specific business goals and objectives that you want to achieve with analytics. Then, ask yourself how you can measure your progress towards these goals.
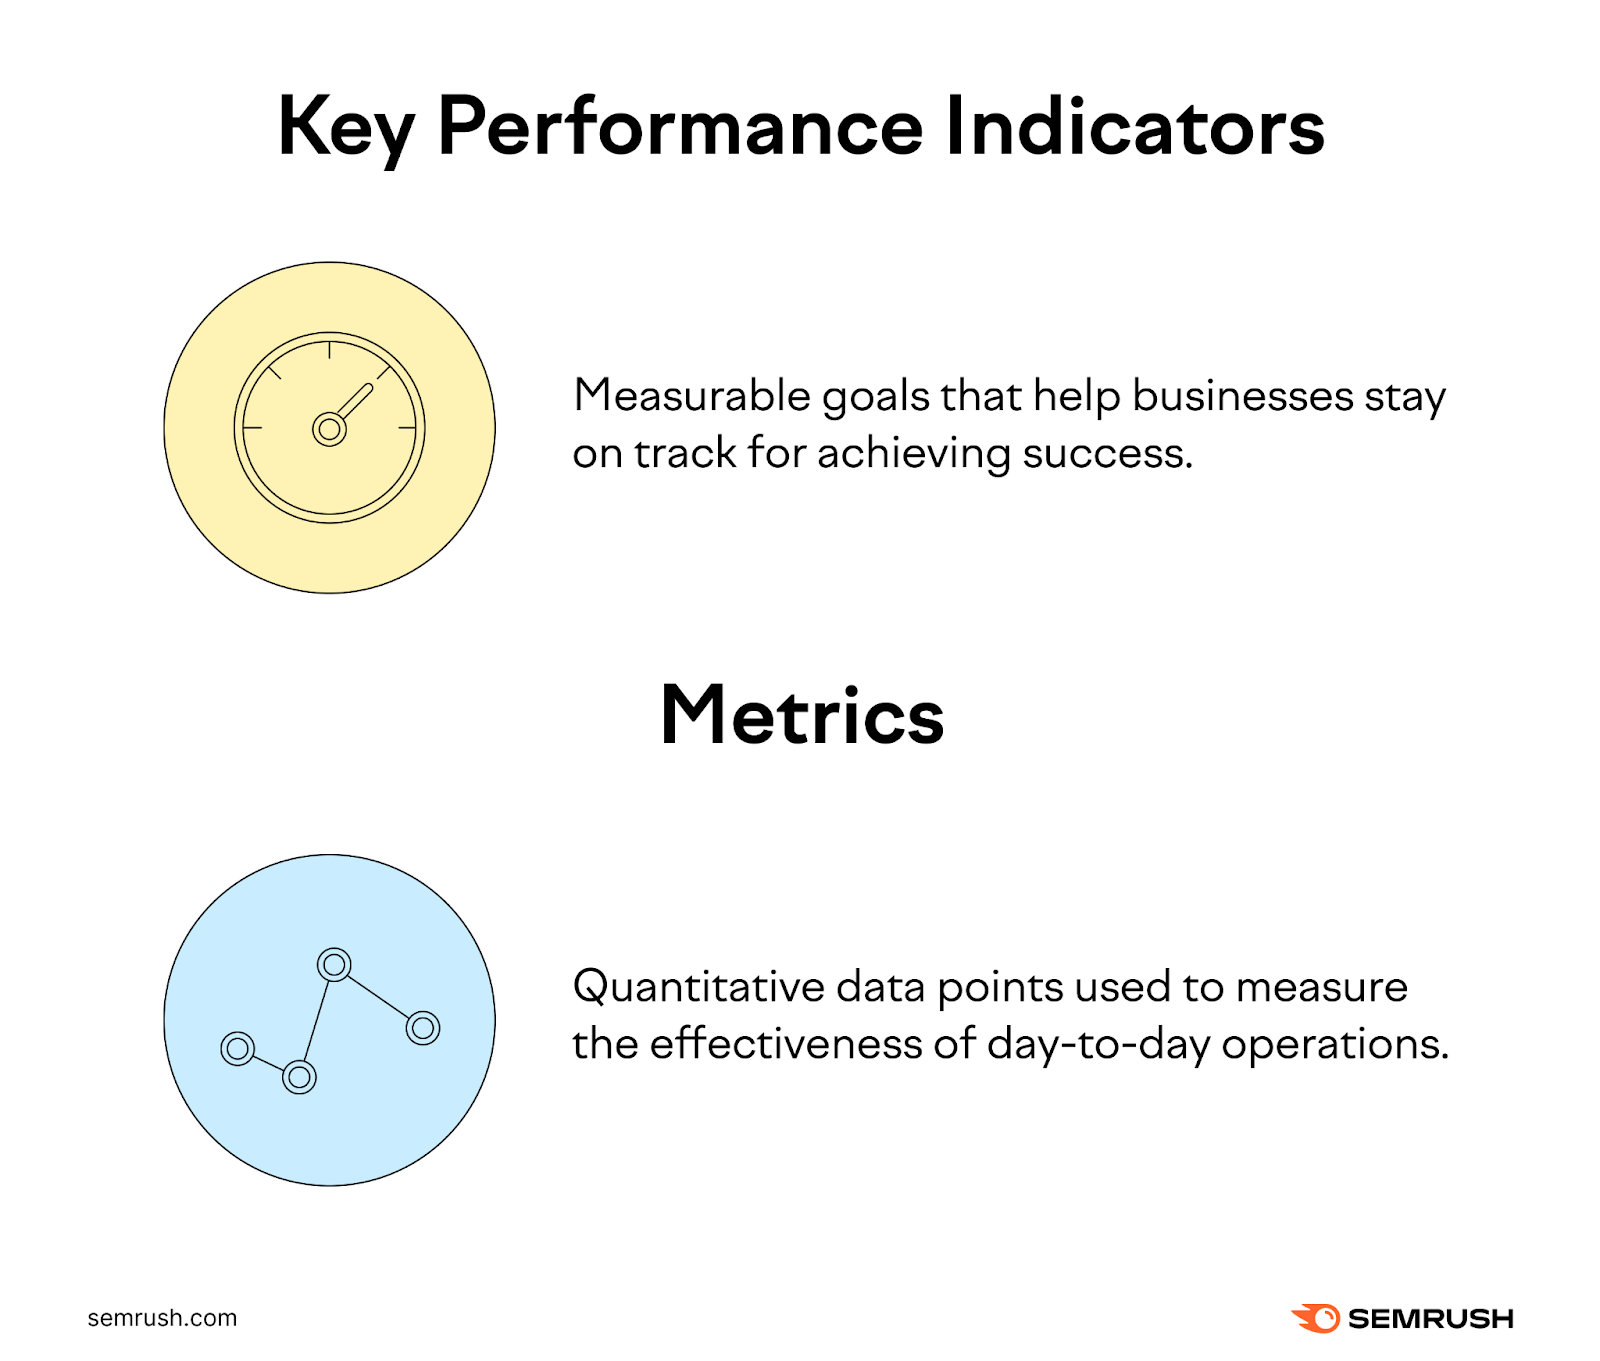
What will your KPIs be? Which metrics will you focus on?
For example, if your goal is to grow your new fitness app, you might track metrics like the number of downloads, number of active users, and average session length.
Your objective in each of these examples will be to grow this number.
You might set the following key performance indicators:
- Hit 50,000 downloads by the end of the quarter
- Increase app logins by 10% this month
- Increase average time spent in-app by 5%
With these KPIs established, you can dig into your data for insights that can help you achieve these KPIs. Including how current users found you. And what demographic data can tell you about your target user.
Provide Training and Support
Invest in training and support to ensure your team members are equipped with the knowledge and skills to use analytics tools successfully.
Help team members use analytics tools and improve their data skills by providing the following resources:
- Group training sessions
- Workshops
- Written and video tutorials
- One-on-one training
- Events and conferences
To enhance data literacy across the organization, encourage collaboration and knowledge sharing.
For example, by adding a peer review step to workflows, asking team members to present their data projects, or running internal competitions or group challenges.
Analytics tools have the power to help grow your business and operate more efficiently.
Some platforms, like Google Analytics and Semrush, can also help improve your marketing efforts. And drive organic traffic to your site. By providing the data and insights you need to make strategic digital marketing decisions.
From keyword research to site audits, Semrush has everything you need to analyze data across channels. And drive steady business growth.