What Is INP?
Interaction to Next Paint (INP) is a web performance metric that measures how quickly a website updates or shows changes after a user interacts with it.
It specifically captures the delay between when a user interacts with your site—like clicking a link, pressing a key on the keyboard, or tapping a button—and when they see a visual response.
INP is one of Google’s Core Web Vitals (a set of metrics indicating how user-friendly a website is).
The other two are:
- Cumulative Layout Shift (CLS): Measures how much page elements move around unexpectedly while the page loads
- Largest Contentful Paint (LCP): Measures how long it takes for the largest content element on a page (like a video or a text block) to load
In March 2024, INP replaced a performance metric called First Input Delay (FID).
First Input Delay vs. Interaction to Next Paint
FID measures how long it takes for your site to respond to a user’s first request by calculating the time from their first interaction to when the site starts processing their input. So, FID only tracks the delay for a person’s initial interaction with the site.
But INP tracks all user interactions during the entire session, and is based on the longest delay the user experiences.
Because of this, INP gives developers and site owners a more holistic view of how responsive a site feels to users.
For example, imagine that a visitor lands on your site and the first thing they do is click on your menu, which takes 100 milliseconds to load. Then, they click on a link in the menu and it takes 400 milliseconds for the linked page to load.
FID would measure only the first engagement of 100 milliseconds. But INP takes all interactions into account and returns a measure of 400 milliseconds.
Why Is INP Important for SEO?
Improving your INP means your website will load and react faster, making it feel more user-friendly.
Specifically, a good INP score helps you achieve:
- Lower bounce rates: People are less likely to leave a site too soon when it responds to their requests quickly. In fact, a Google case study explains how The Economic Times decreased its bounce rate by 50% after improving its INP.
- Better performance in search rankings: As a part of Google’s Core Web Vitals, INP influences how Google evaluates your website’s rankings. Sites with lower INP scores tend to be viewed more favorably in search rankings because they offer a smoother user experience.
- Increased conversion rates: When INP gets worse, conversions tend to suffer. Because people are less likely to complete purchases or sign up for services on a site that feels sluggish.
What Is a Good INP?
A good INP score is 200 milliseconds or less, according to Google.
Your site needs to meet this threshold to pass Google’s Core Web Vitals test. And ensure a good user experience (UX).
An INP score of between 200 and 500 milliseconds means your site’s interactivity needs improvement. And an INP score of 500 milliseconds or higher is a poor score that means your site is slow to respond to user requests.
Anything that falls below the good threshold can frustrate visitors. Because they might think something is wrong with the website or their own device. And leave your site as a result.
How to Measure INP
Here are four tools you can use to monitor your INP:
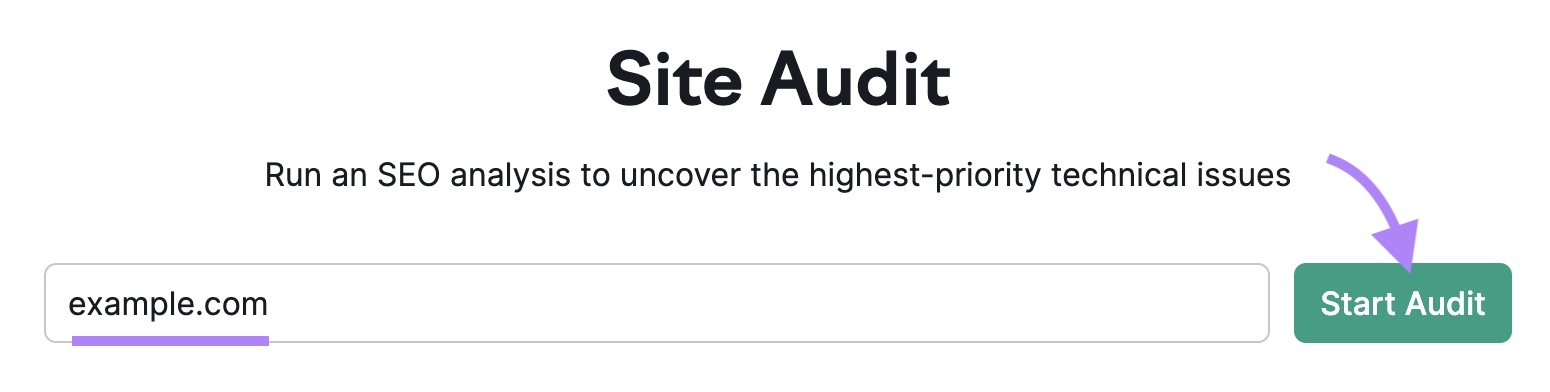
Site Audit
Semrush’s Site Audit tool runs a holistic website health check and identifies over 140 unique technical and on-page issues. Including your site’s Core Web Vitals.
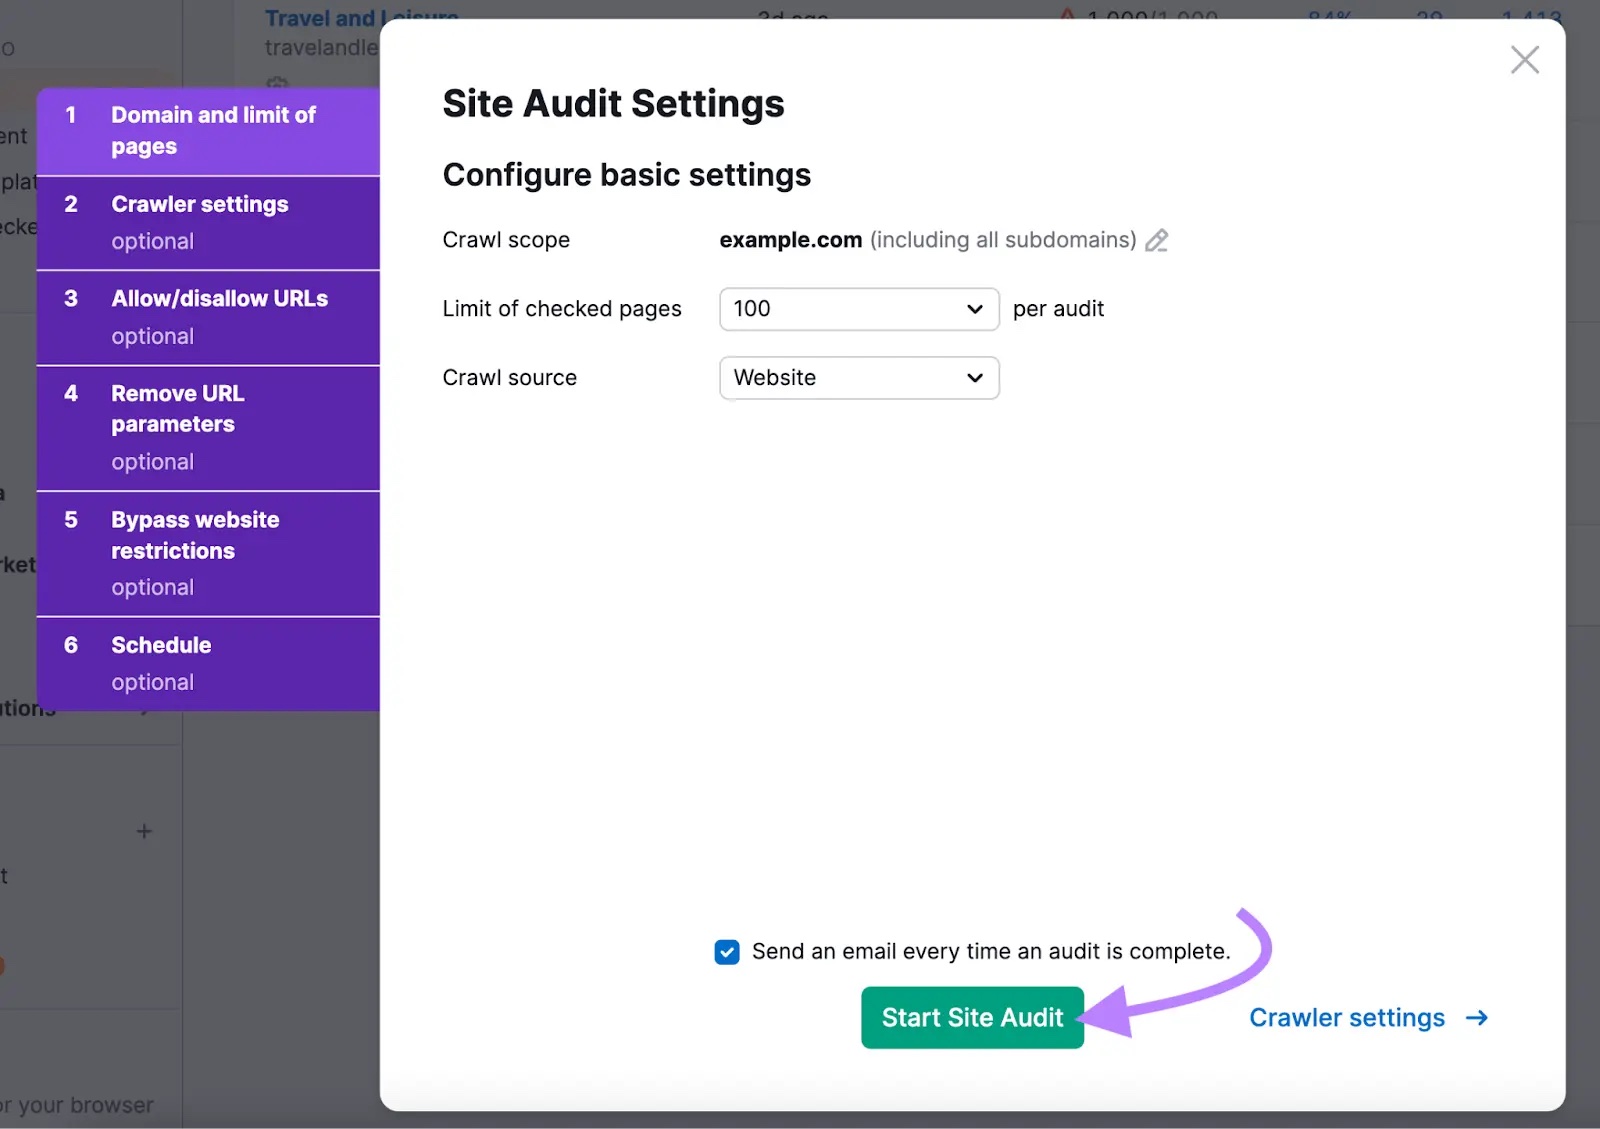
Open the tool, type in your domain, and click “Start audit.”
Next, configure your audit settings. This includes setting the scope and customizing the specifics of the audit.
If you’re new to the tool, proceed with the standard settings. Or check out our Site Audit configuration guide for specific information on how to customize your audit.
When you’re ready, click “Start Site Audit.”
When your audit is done, you’ll see an “Overview” page like this one:
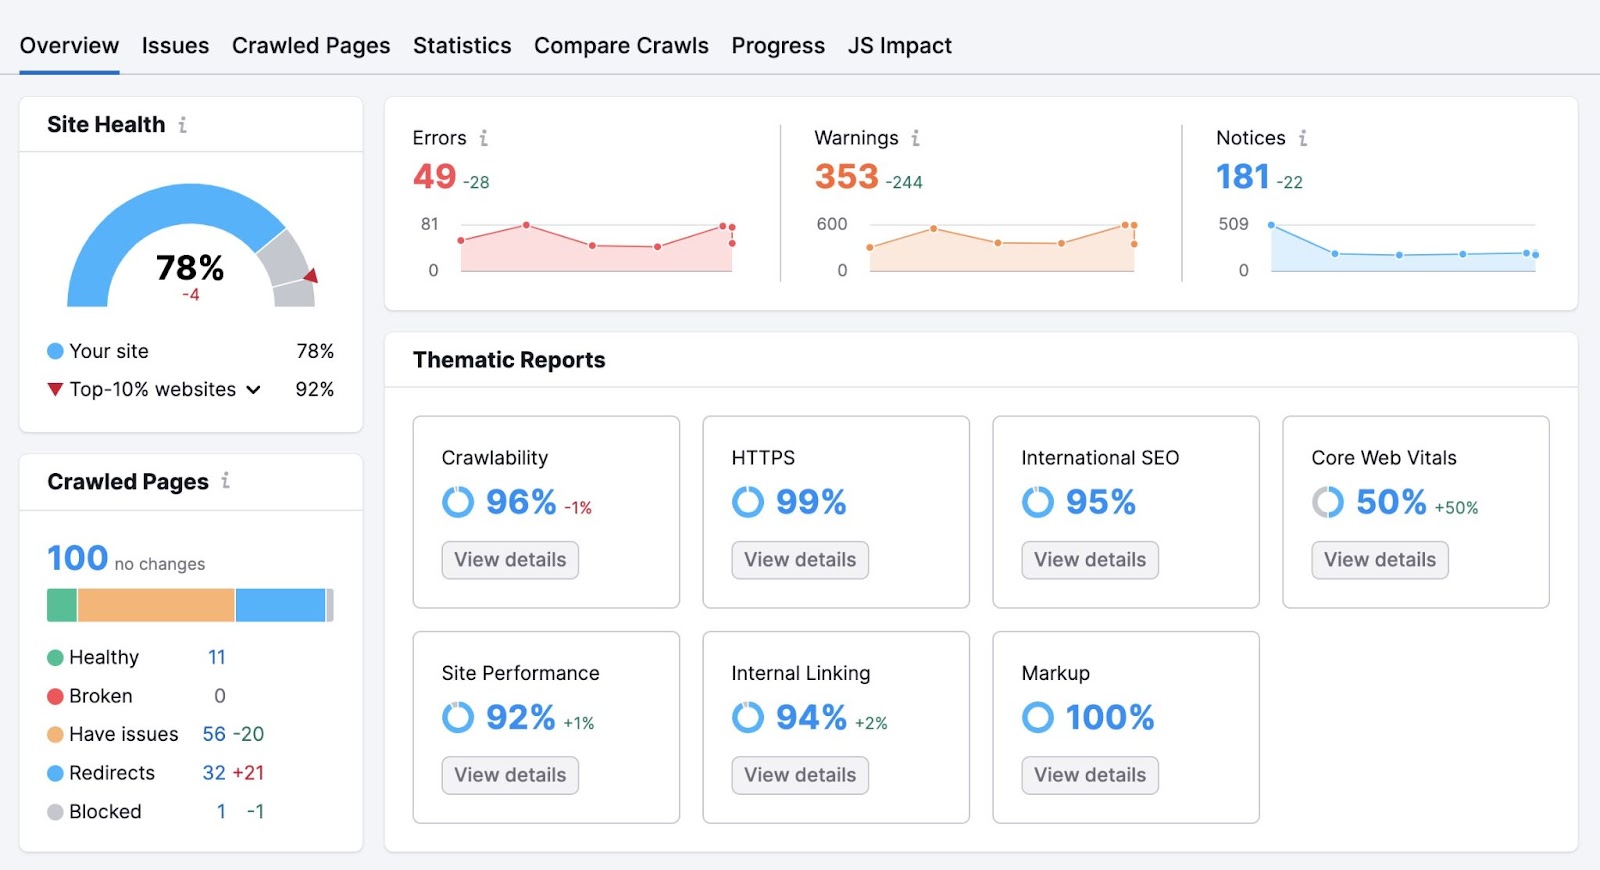
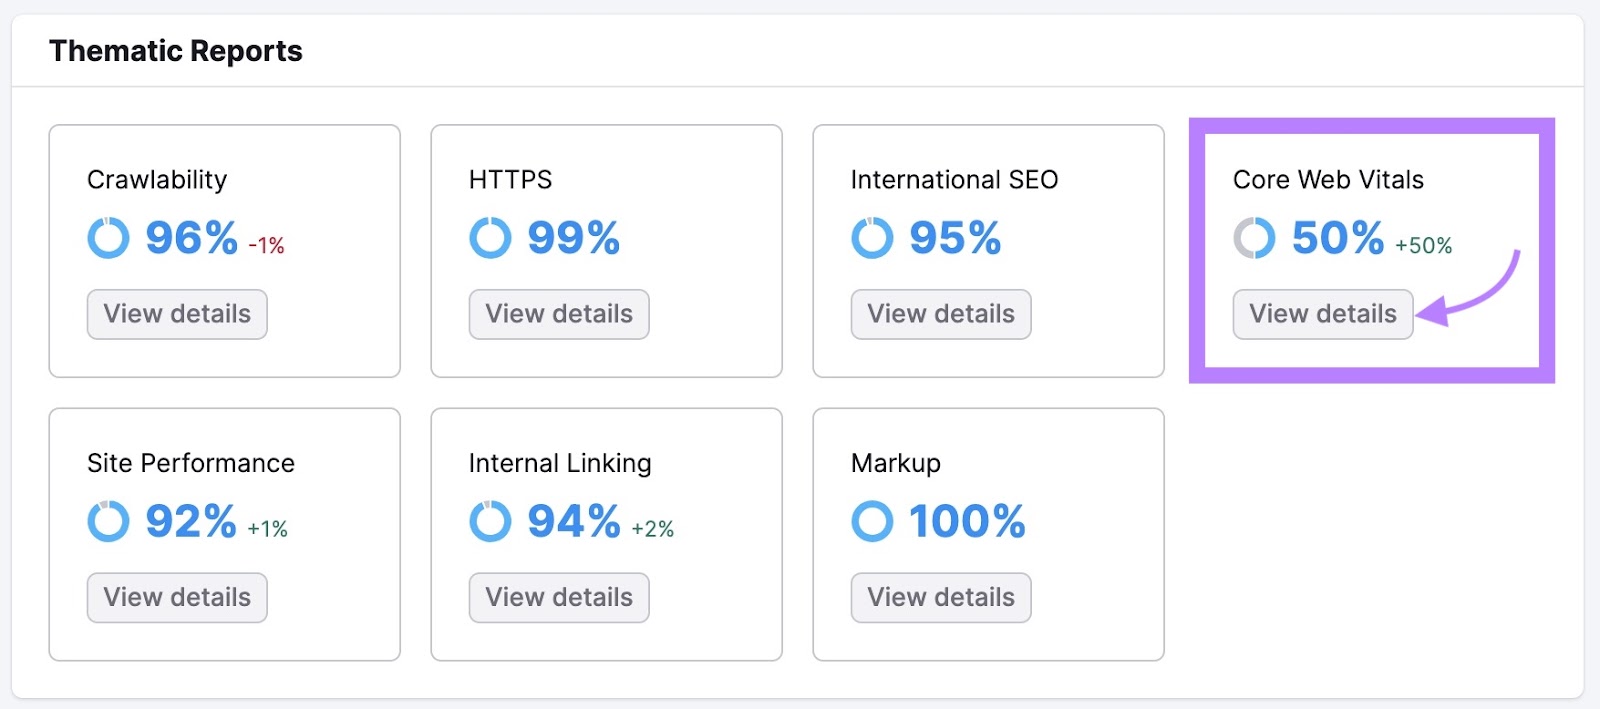
Under “Thematic Reports,” you’ll find your “Core Web Vitals” report widget. Click “View details”.
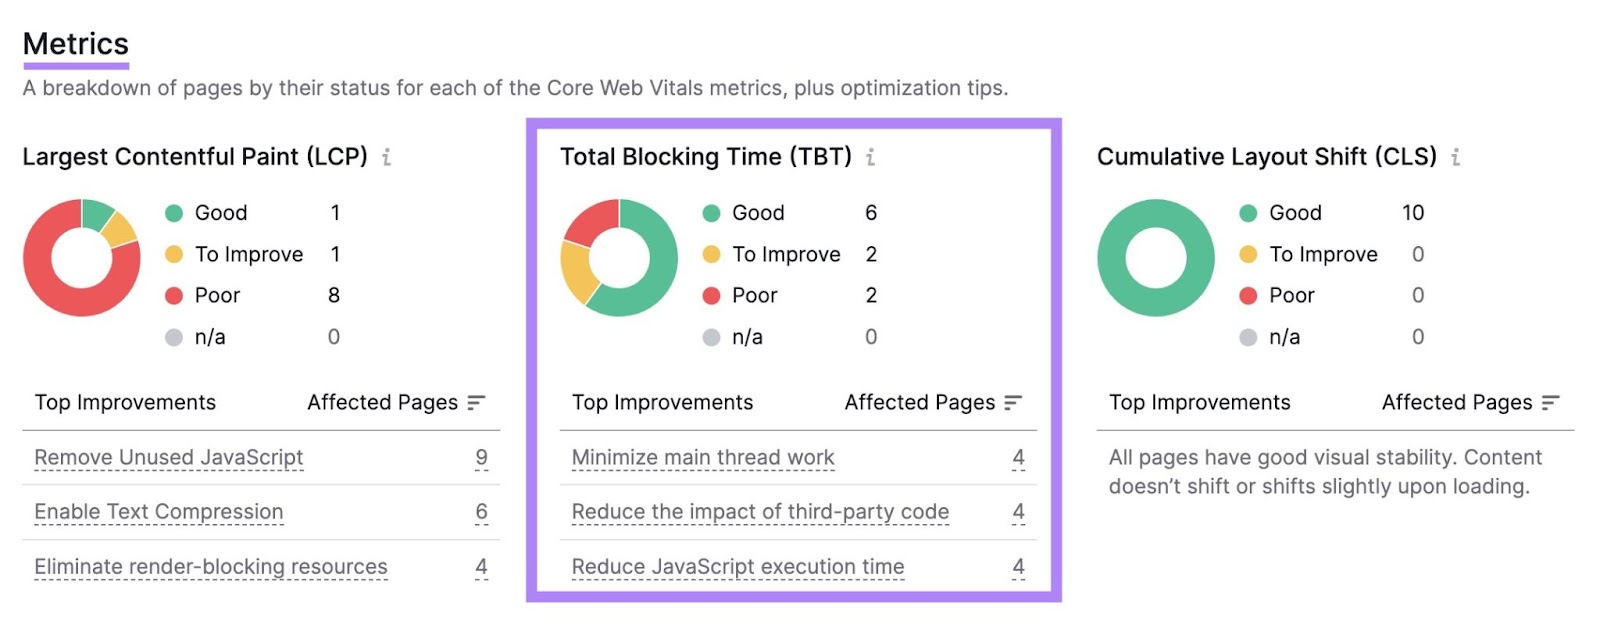
Scroll down to the “Metrics” section. Here, you’ll see your LCP and CLS scores. Along with another metric called Total Blocking Time (TBT).
TBT measures the amount of time a webpage is unresponsive to user inputs while it’s loading.
Site Audit uses TBT to assess INP. Because the tool relies on lab data to simulate user interactions. And INP is only measured using feedback from actual users.
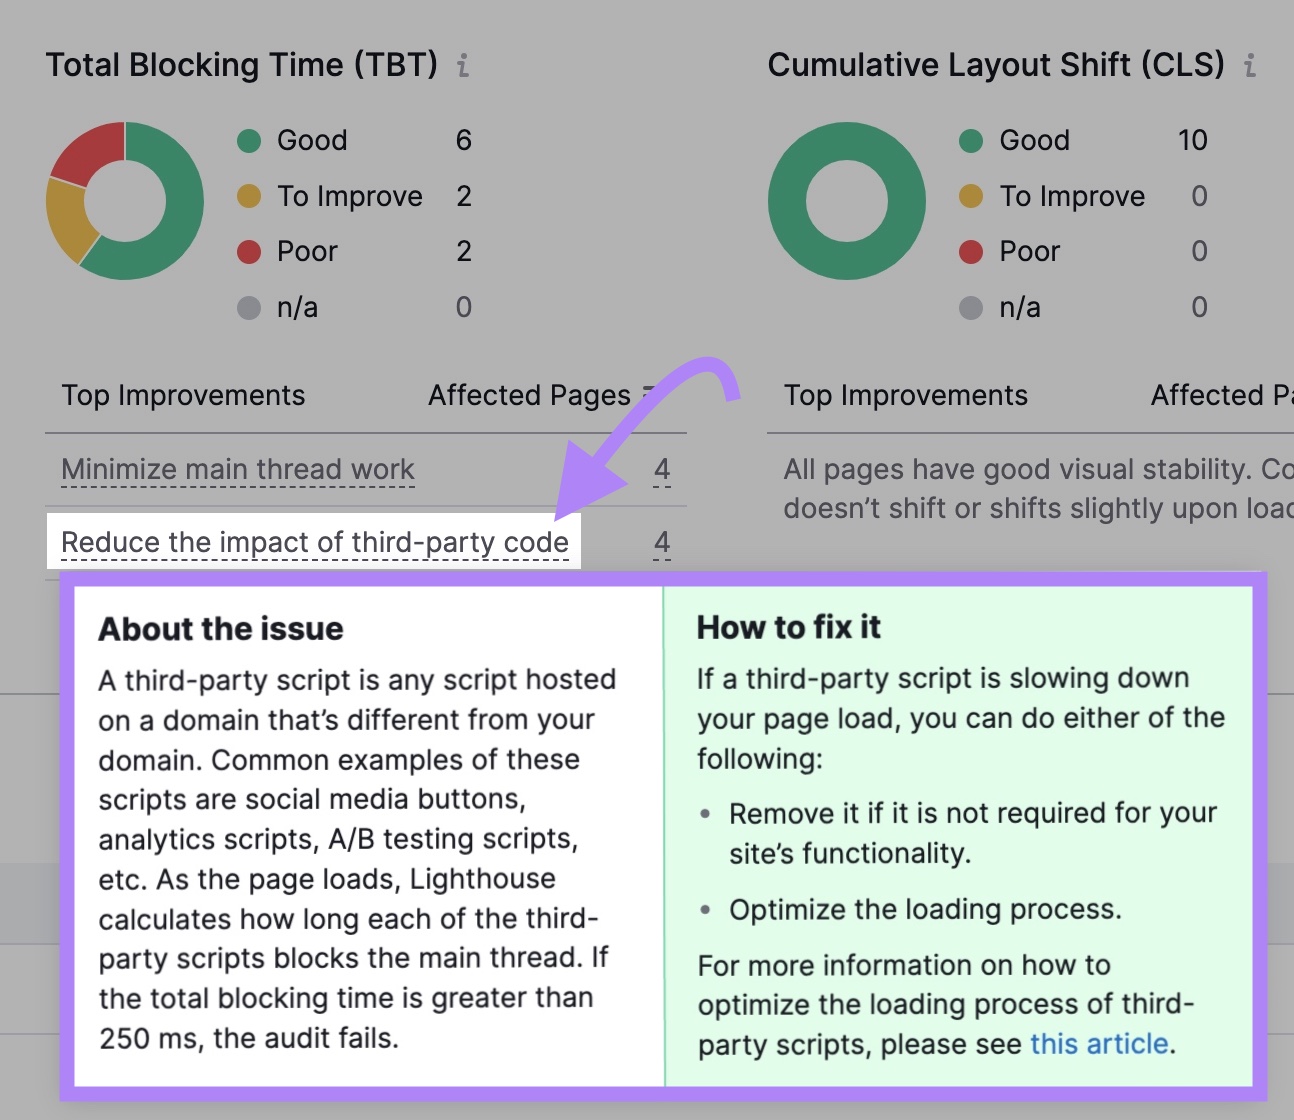
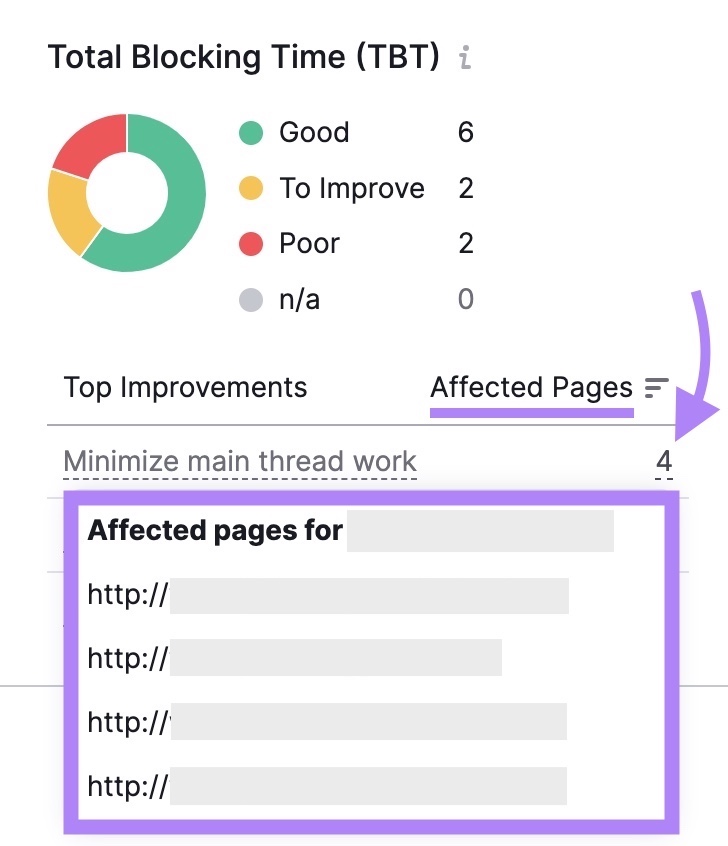
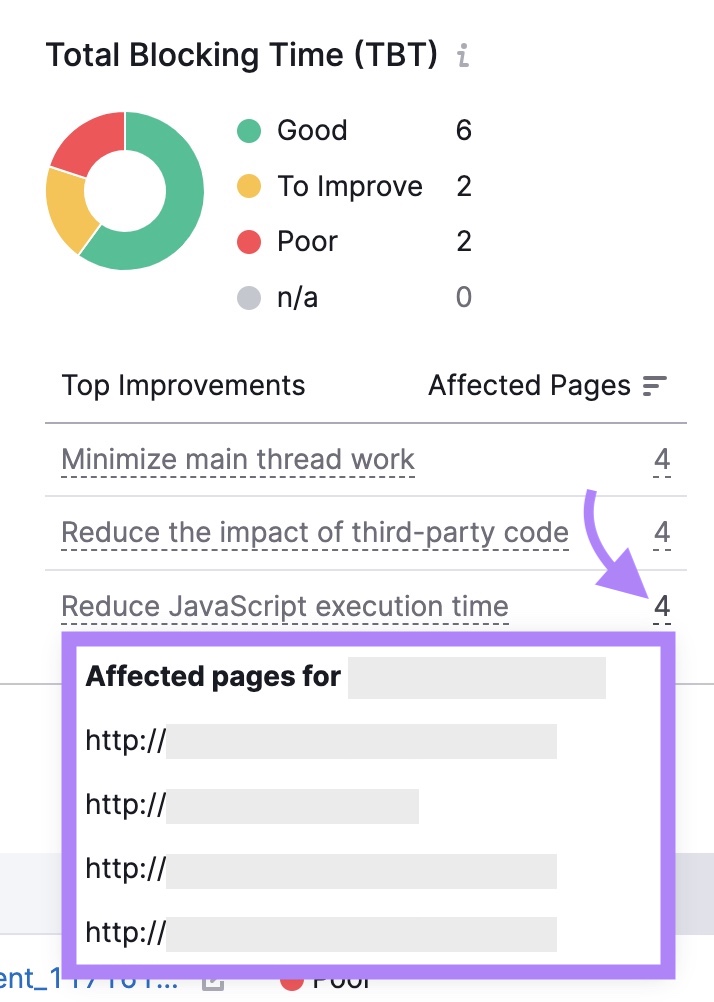
Click on an issue under the “Top Improvements” column to learn more about the issue and how to fix it.
Like this:
Select the number under the “Affected Pages” column for a full list of pages with the issue.
Do this for each issue listed. And address the problems the tool has identified to improve your Interaction to Next Paint score.
Chrome User Experience Report
Your Chrome User Experience (CrUX) report provides performance data on how real Chrome users experience your site.
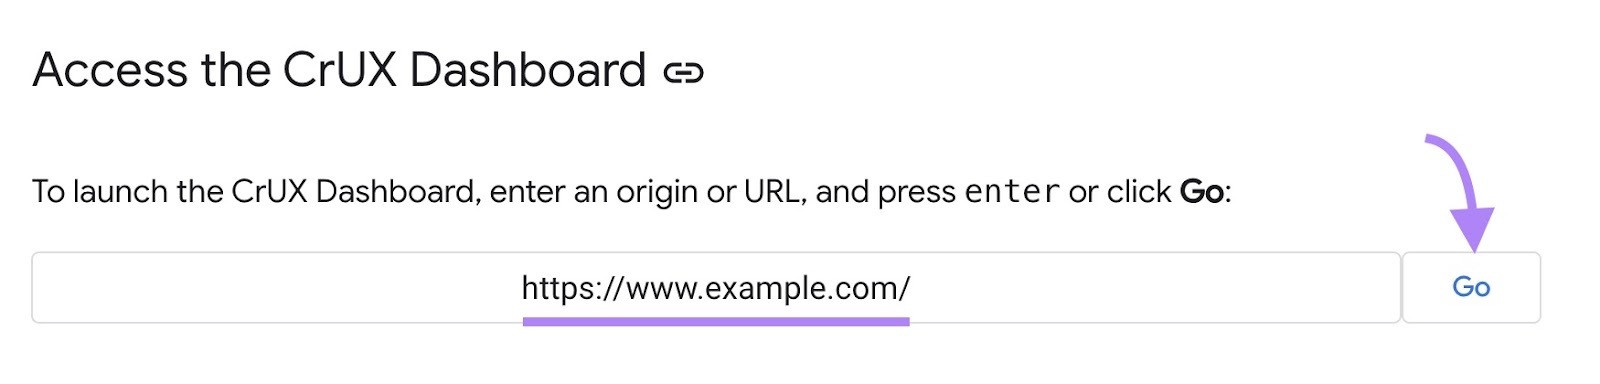
The easiest way to access CrUX is through the CrUX Dashboard.
Open the tool, enter the URL of the site you want to track, and click “Go.”
Once your report is ready, you’ll see a breakdown of all your Core Web Vitals. For both mobile and desktop users.
Navigate to “Interaction to Next Paint” from the menu on the left to home in on your INP.
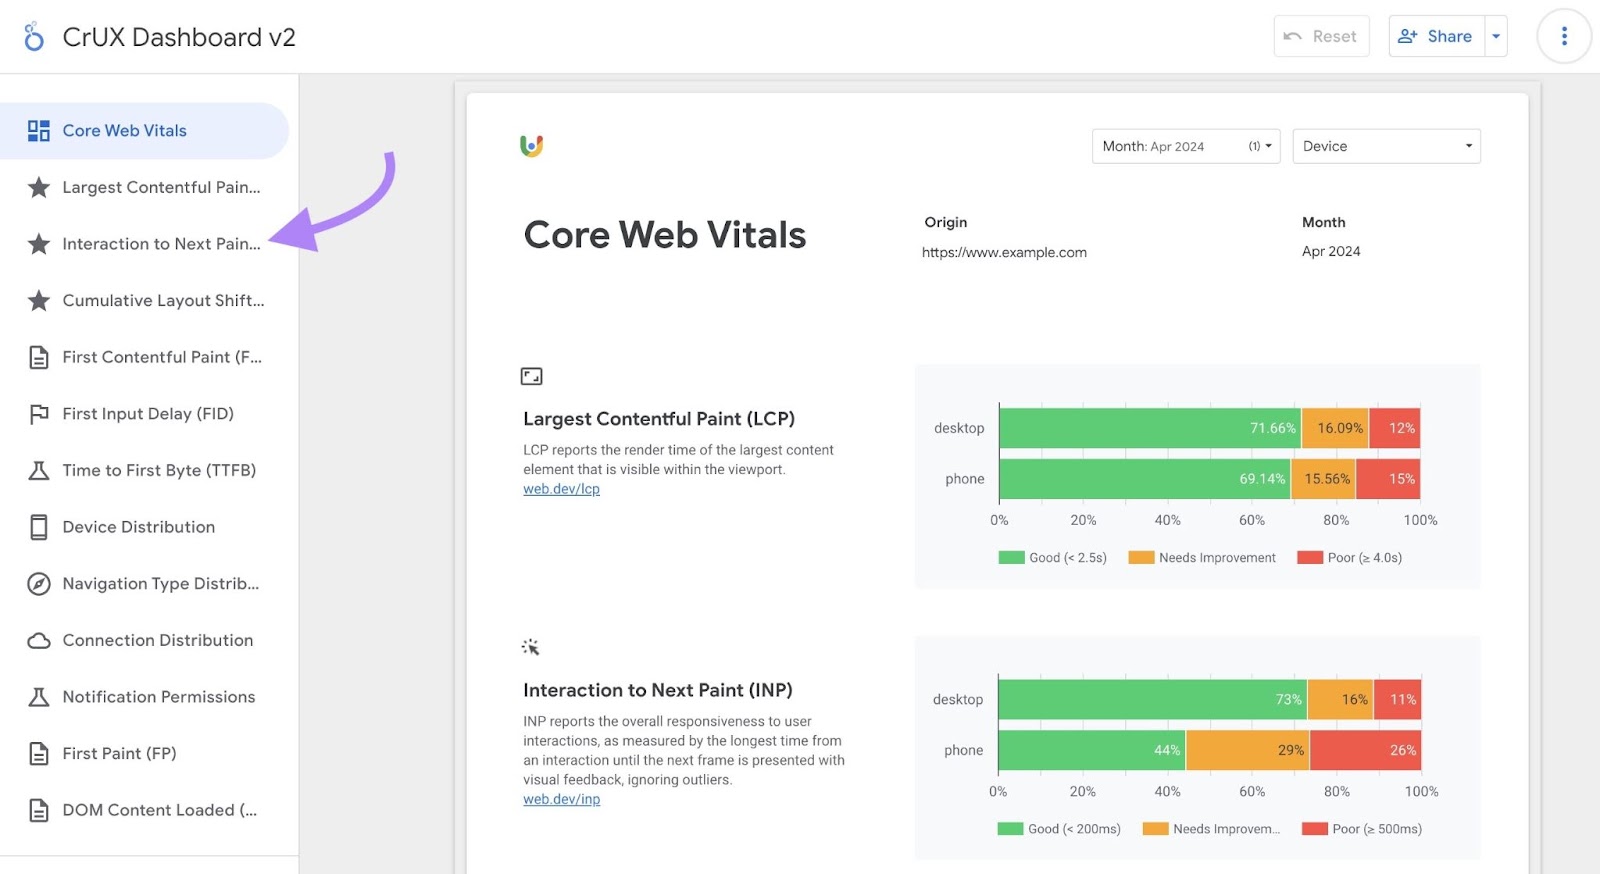
This report shows you a detailed breakdown of your site’s INP over the past few months.
In this particular case, you can see that 65.9% of pages had a good INP score in July 2023. While 17.87% had a poor INP score.
And that in April 2024, 67.91% of pages had a good INP score. And 14.1% of pages had a poor score.
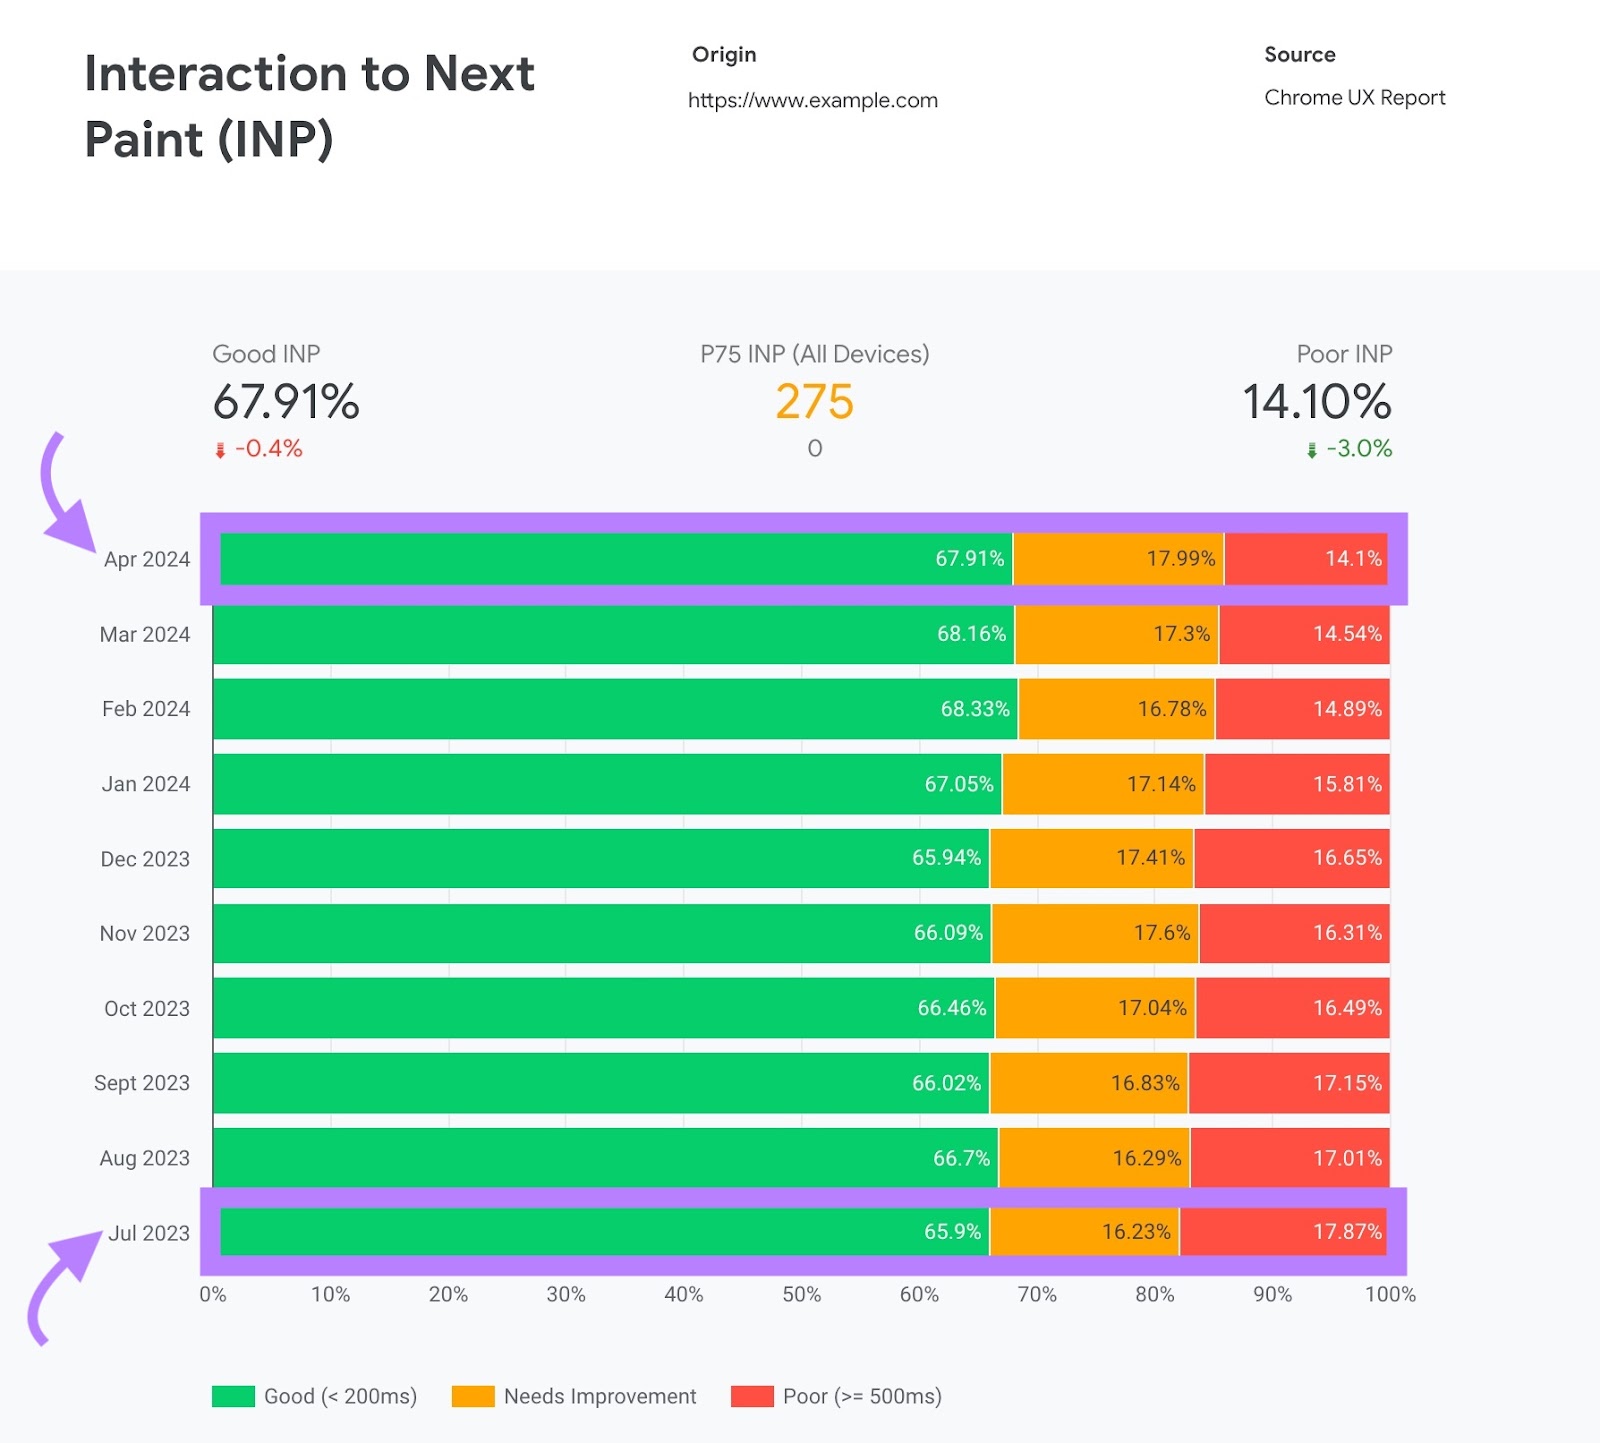
This helps you understand how your site’s interactivity has changed over time. So you can spot if, and when, it starts to become sluggish for users.
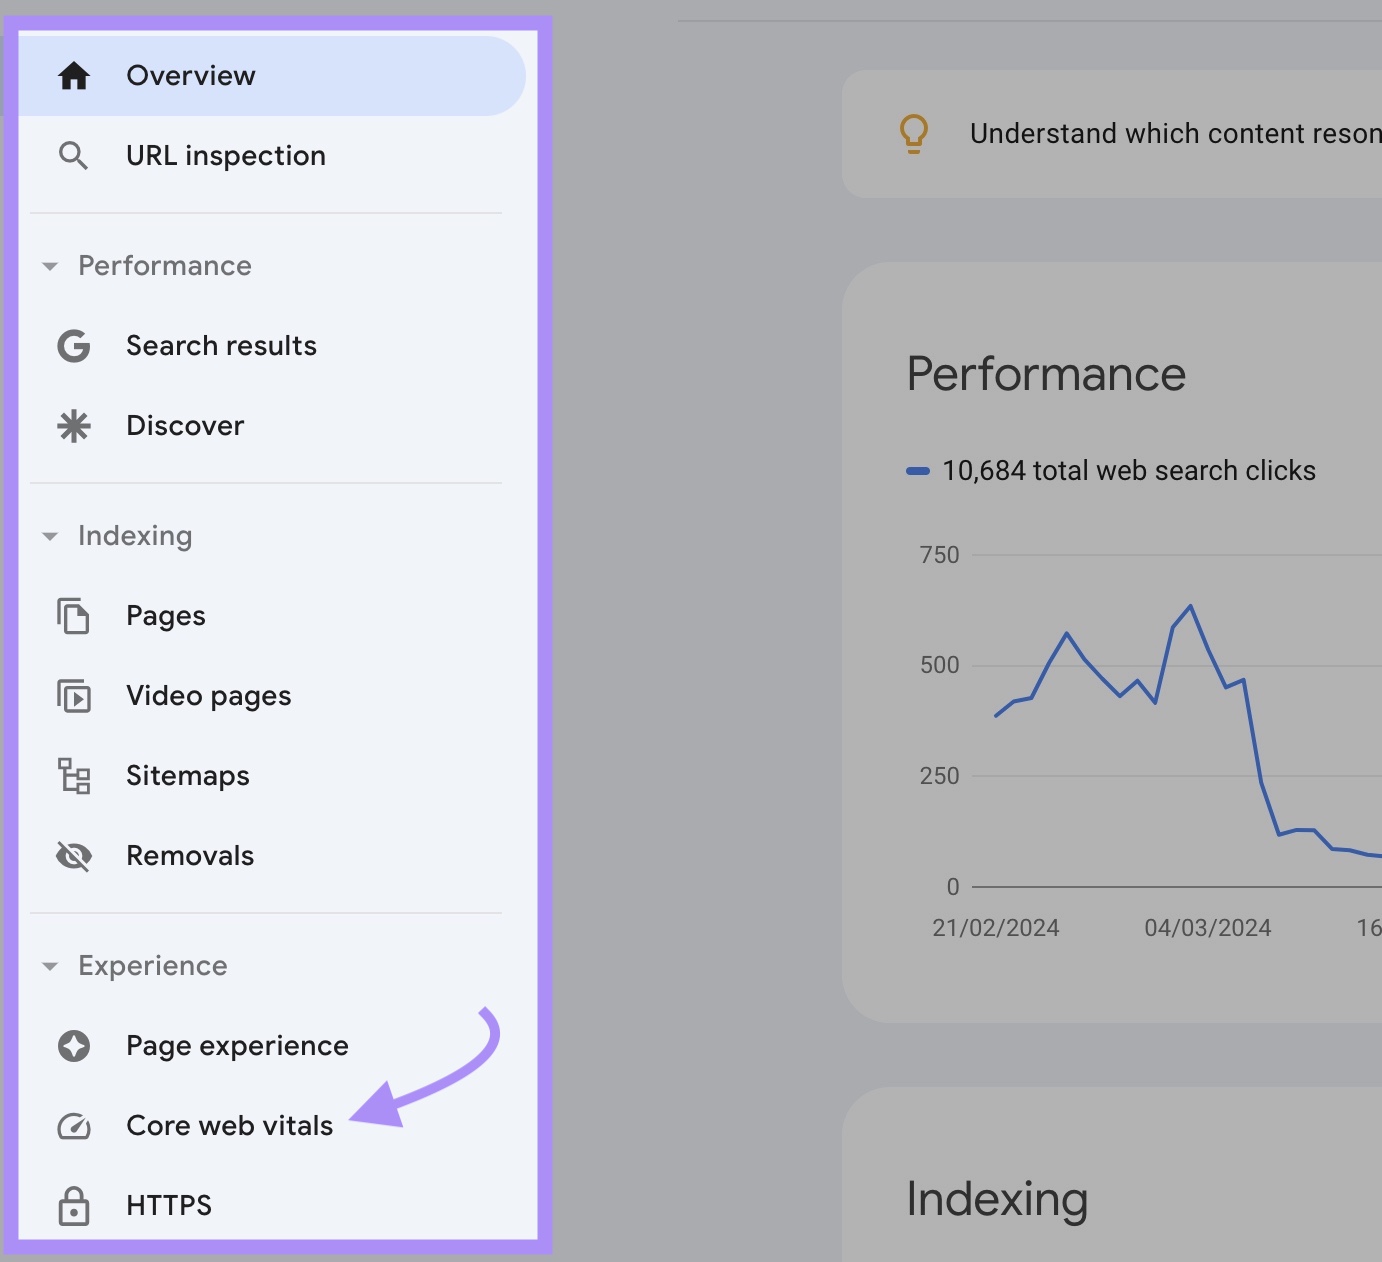
Google Search Console
The “Core Web Vitals” report in Google Search Console (GSC) uses real-word data to give you insights on your site.
To access this report, sign in to GSC and select “Core web vitals” from the menu on the left.
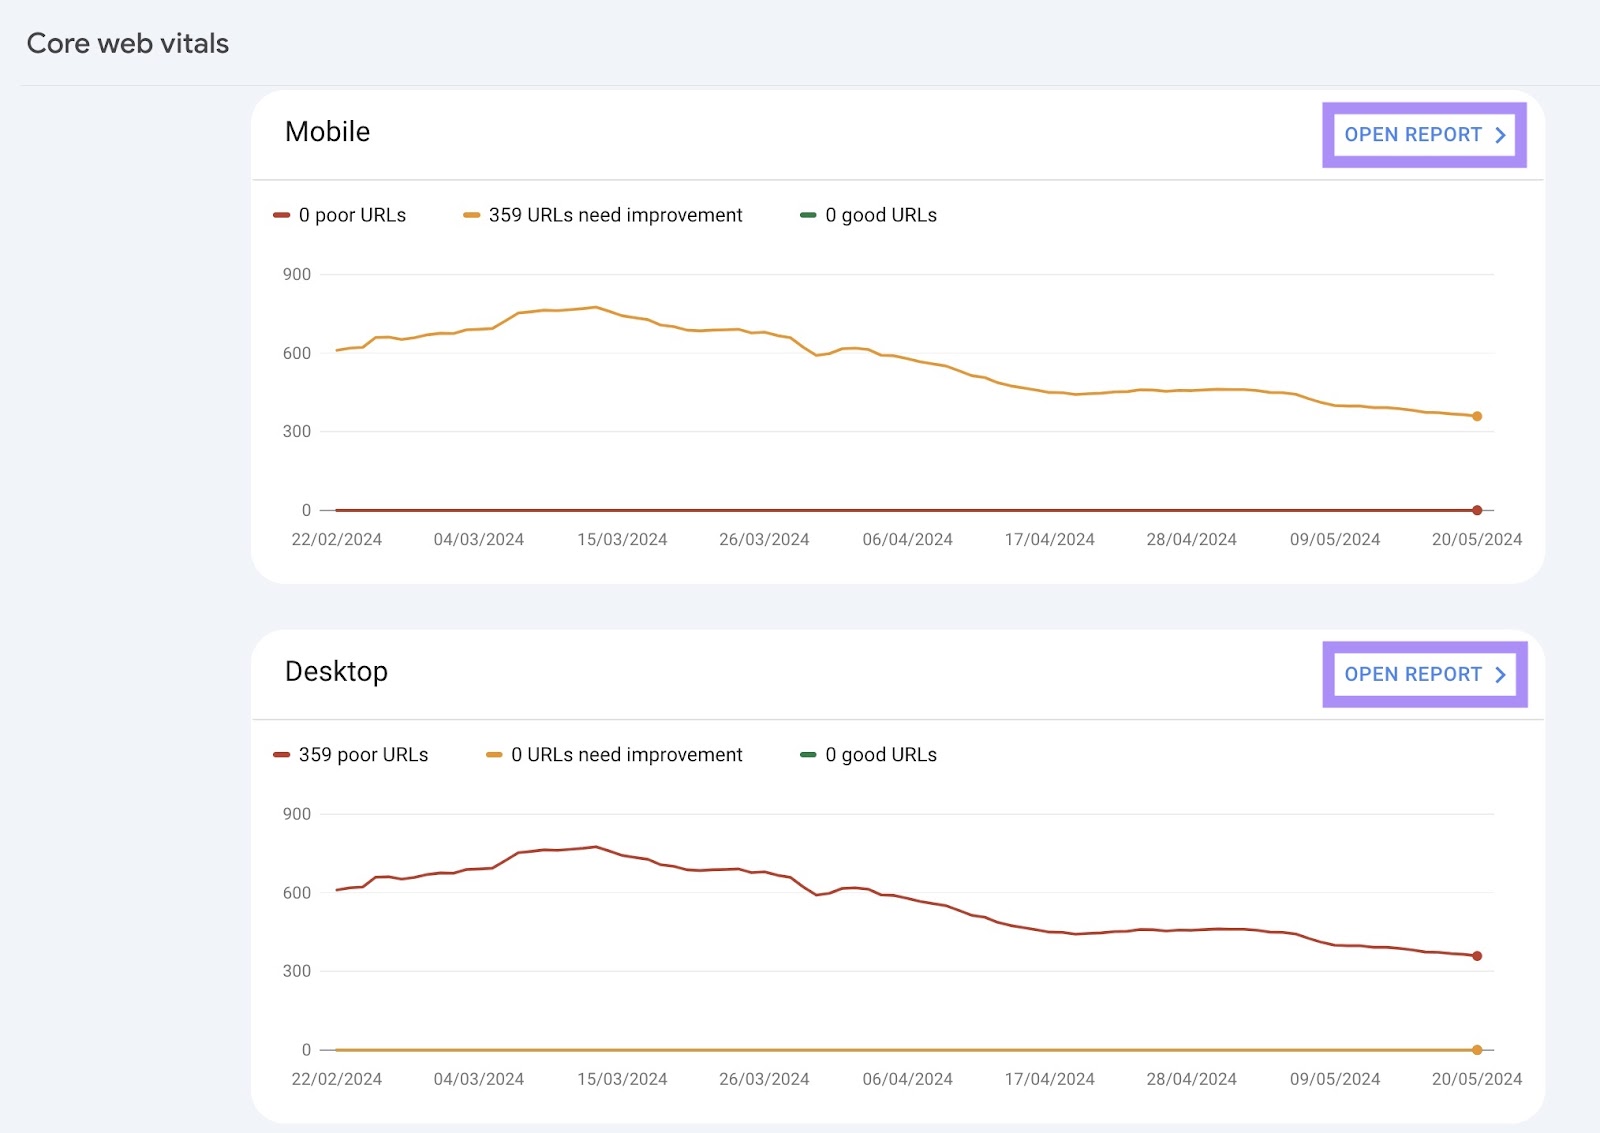
You’ll see an overview page including two charts. One each for your URLs on desktop and mobile.
Click “Open report” in either chart for more details.
Scroll down to the “Why URLs aren’t considered good” section to check for any INP issues.
If your site has INP problems, you’ll find a row that says “INP issue:” listed under the “Issue” column detailing the concern.
Like this:
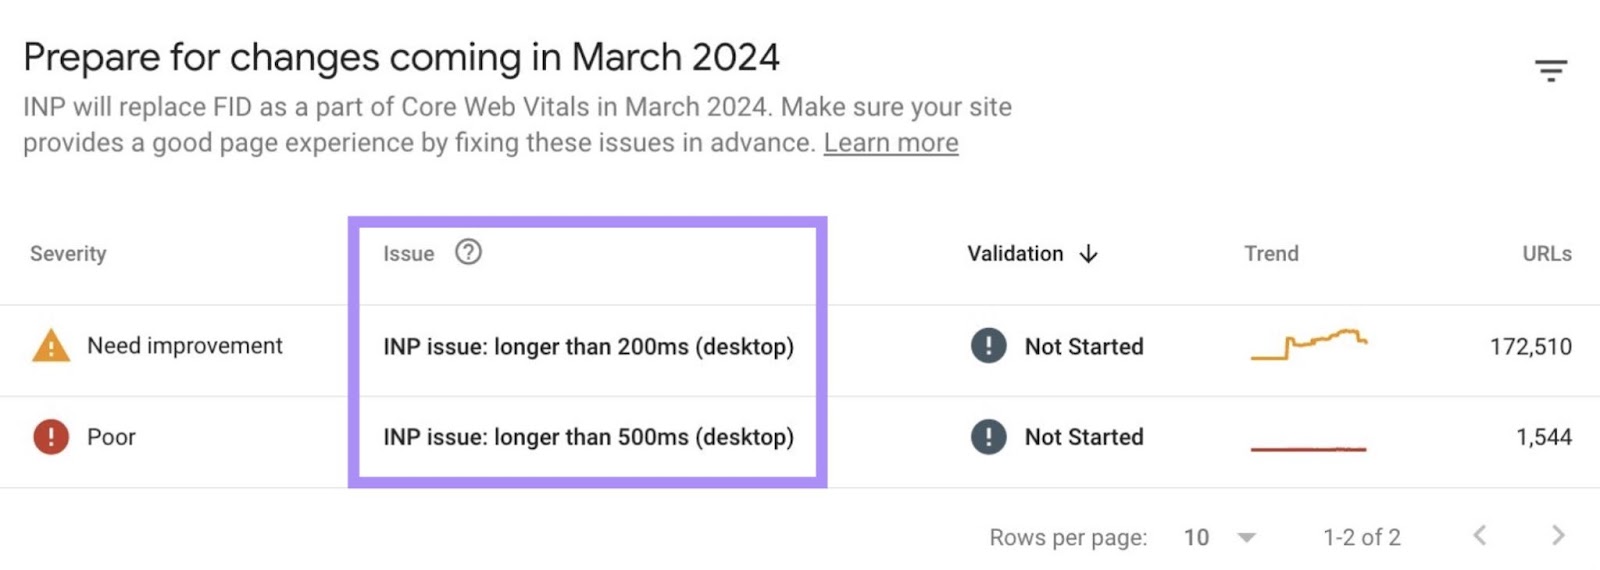
Click on the issue for more details.
PageSpeed Insights
Google’s PageSpeed Insights (PSI) is a free tool that evaluates the Core Web Vitals of a single webpage.
It also identifies different performance and SEO issues on that webpage. So you can make it faster and more user-friendly.
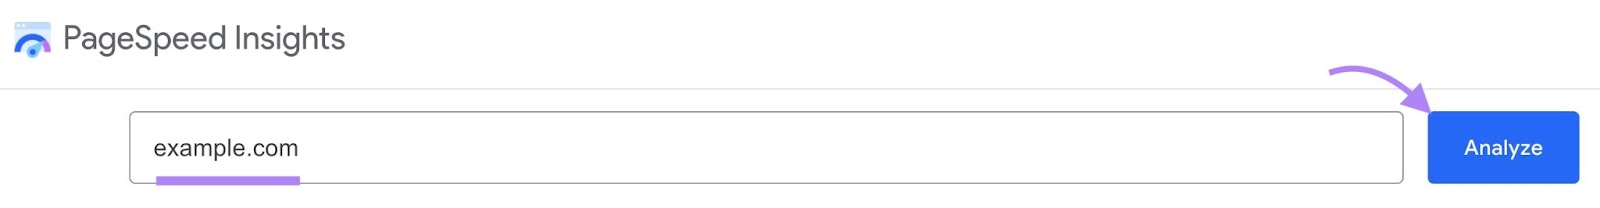
Open PageSpeed Insights, enter the URL you want to examine, and click “Analyze.”
You can find your INP score under the “Core Web Vitals Assessment” section.
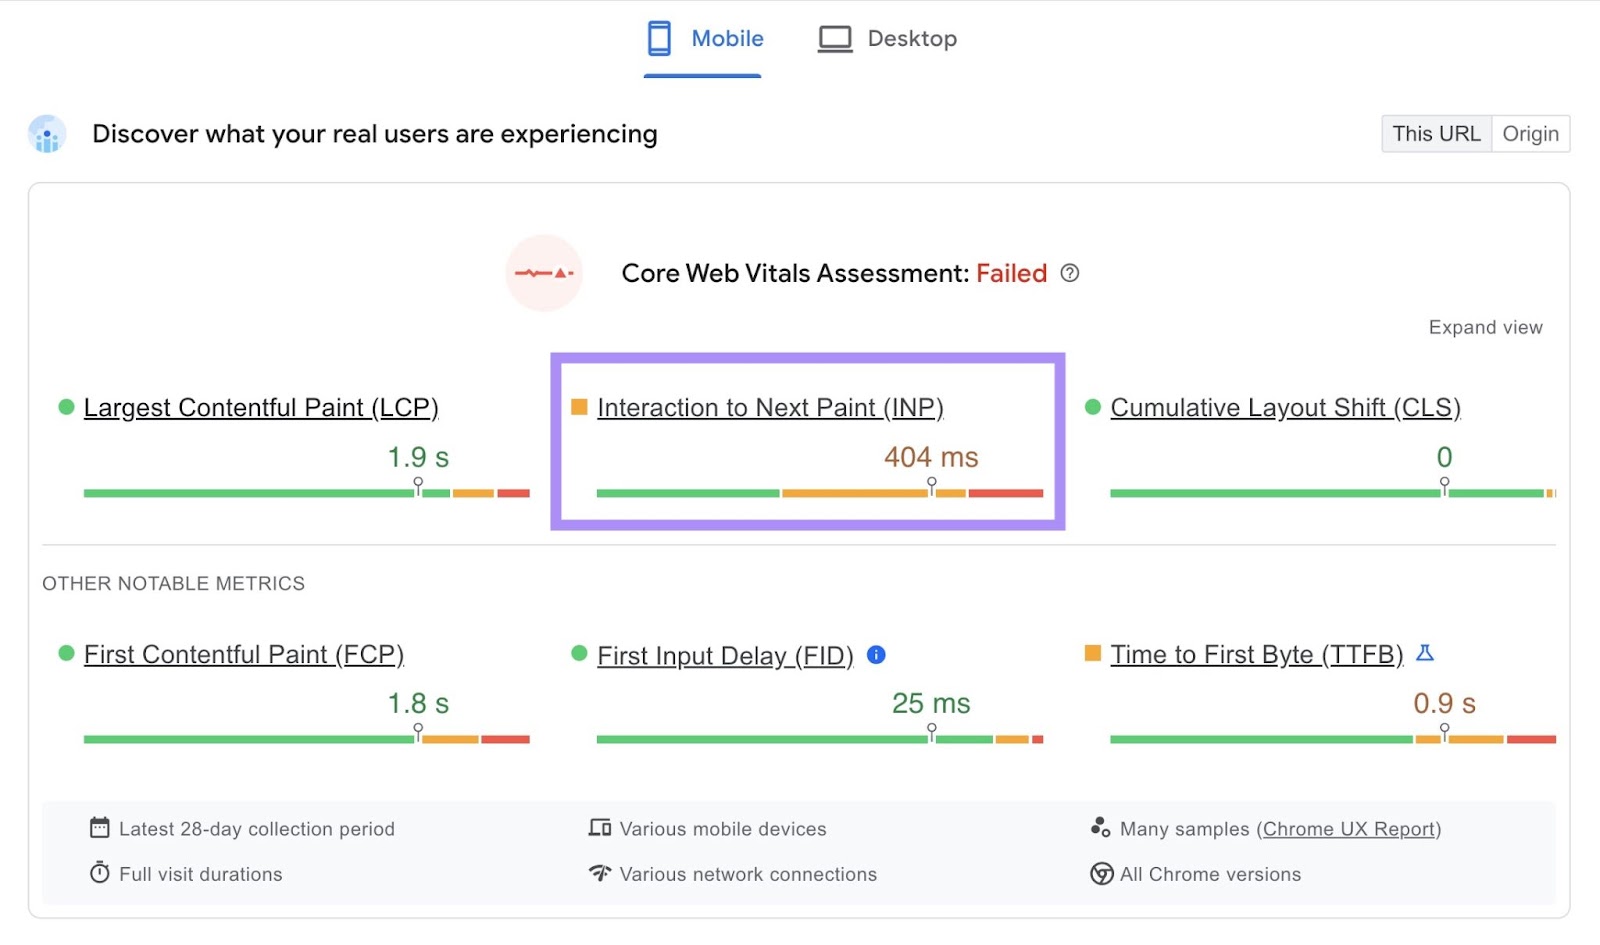
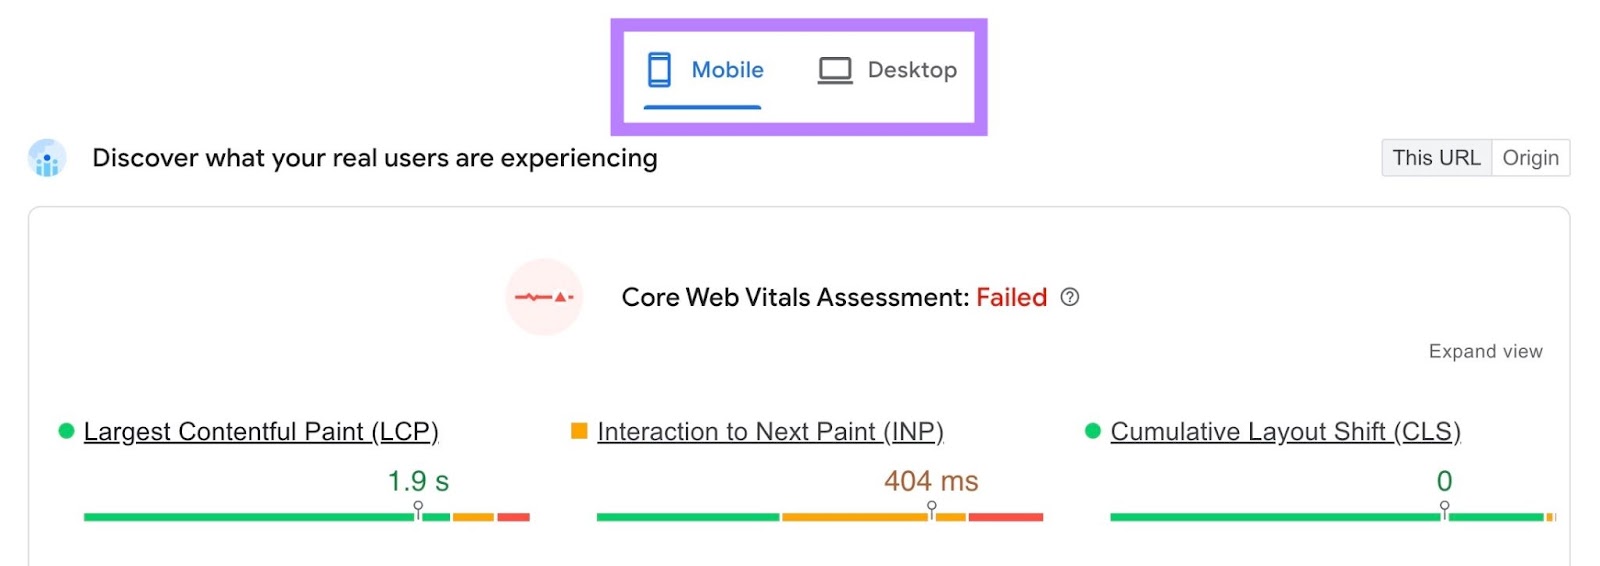
Note that you’ll automatically see results for the mobile version of your page. To view your desktop report, select “Desktop” from the top of the page.
Scroll down to the “Diagnostics” section and filter for “TBT” to see recommendations specifically related to your page’s Total Blocking Time.
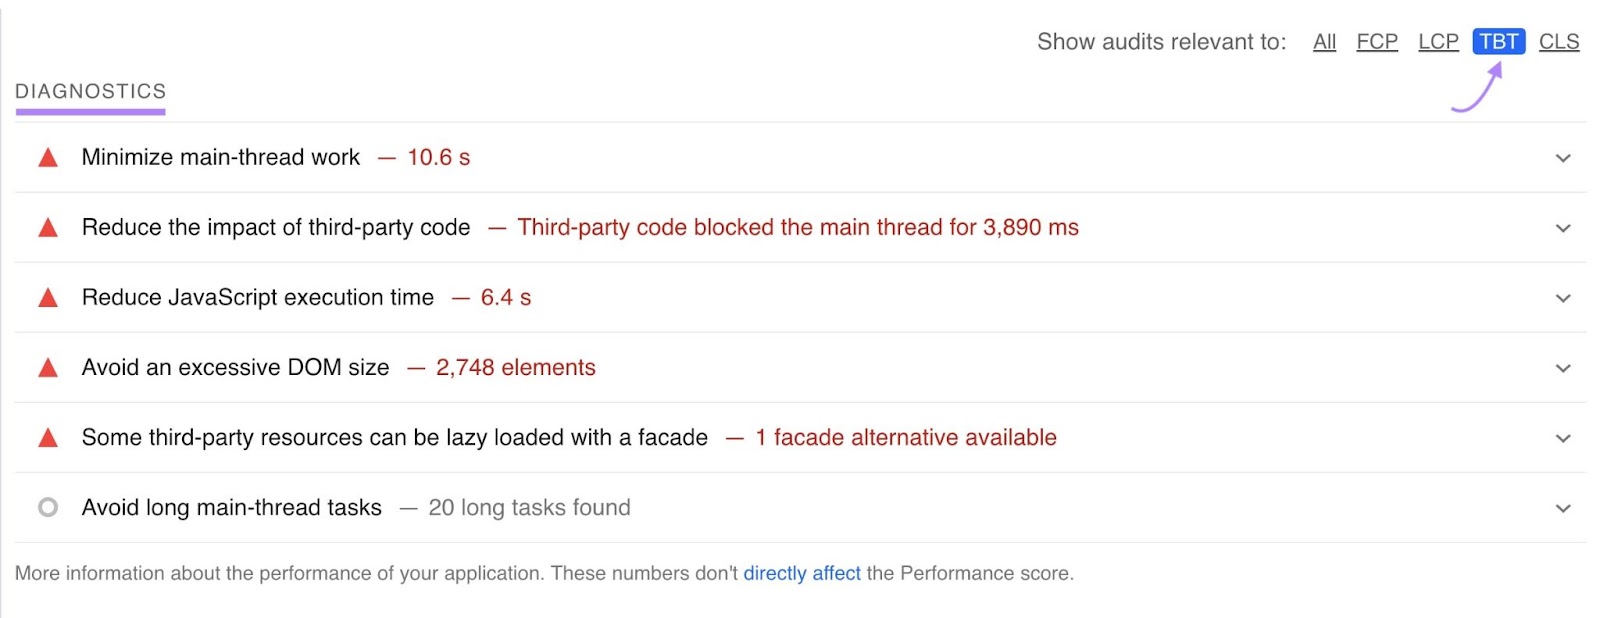
As with Site Audit, addressing these issues related to TBT can improve your Interaction to Next Paint score.
How to Optimize Interaction to Next Paint
Did a report show Interaction to Next Paint issues? Here are some of the best ways to improve your score:
Reduce Page Size
Reducing page size helps speed up how quickly a webpage becomes interactive. Google recommends keeping your page size under 500 KB.
To discover the size of your webpage, open the page in a browser like Chrome or Firefox.
Right-click on the page and select “Inspect.”
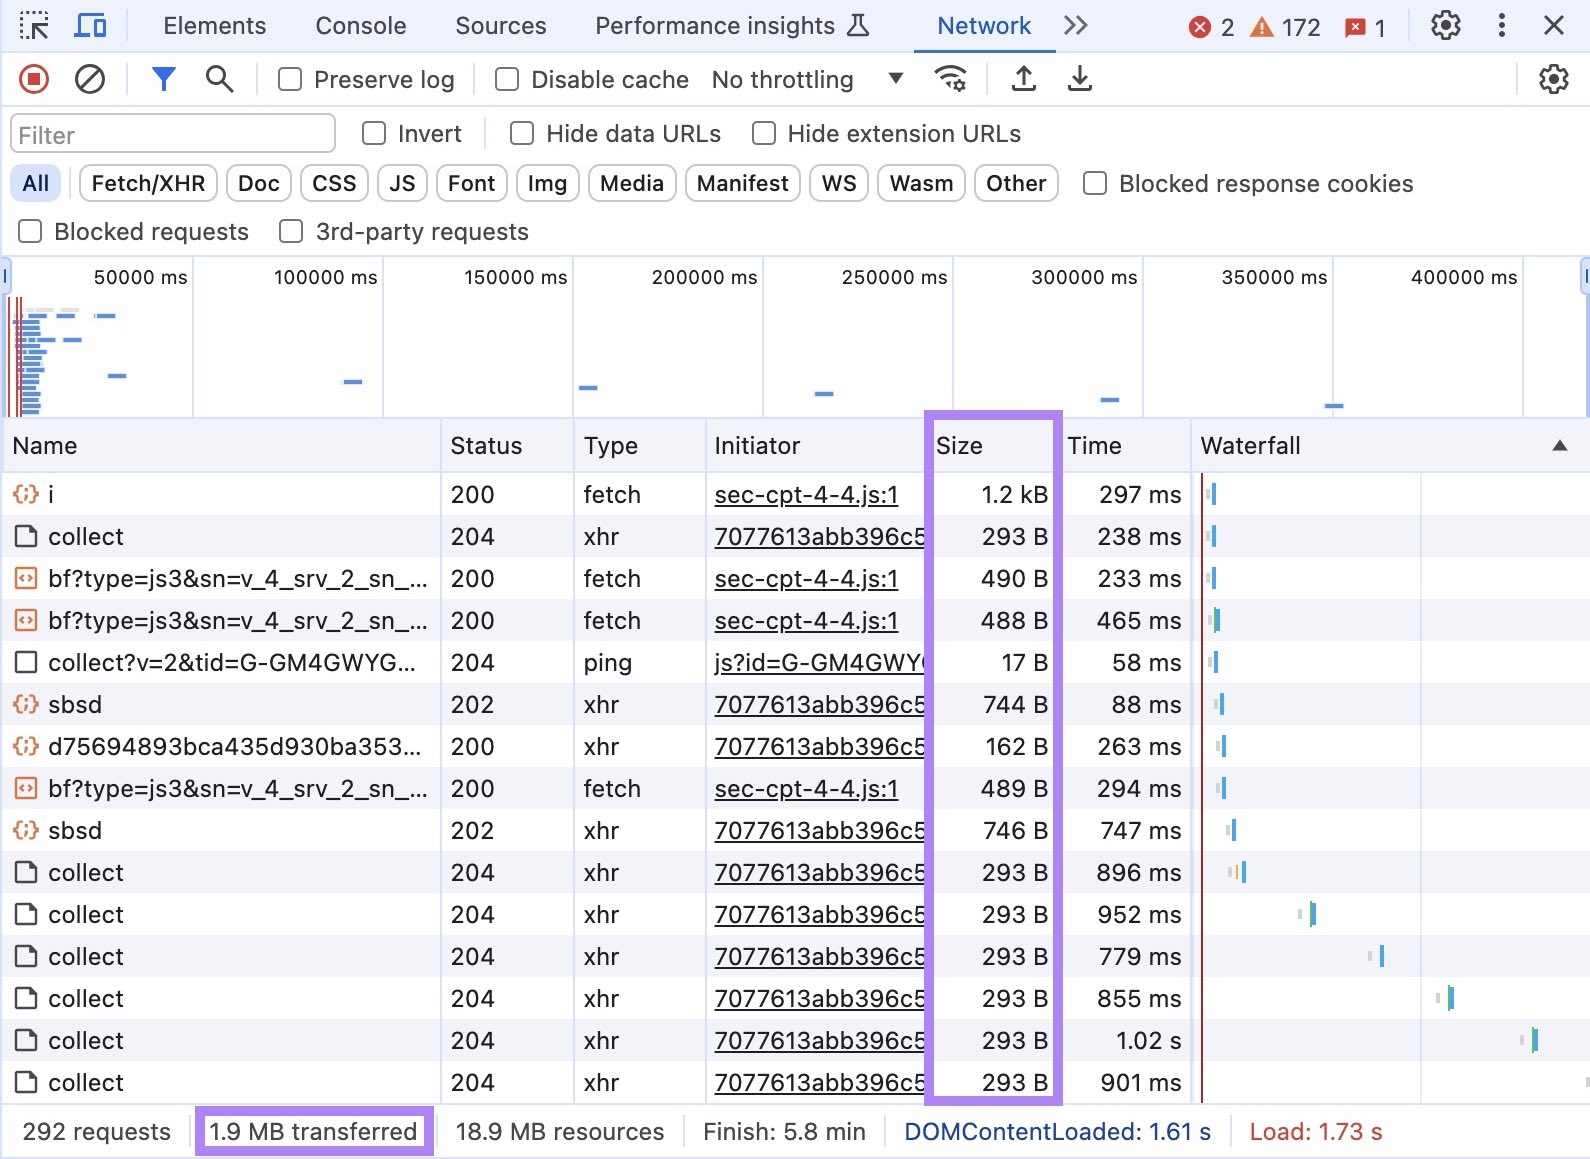
Go to the “Network” tab and reload the page.
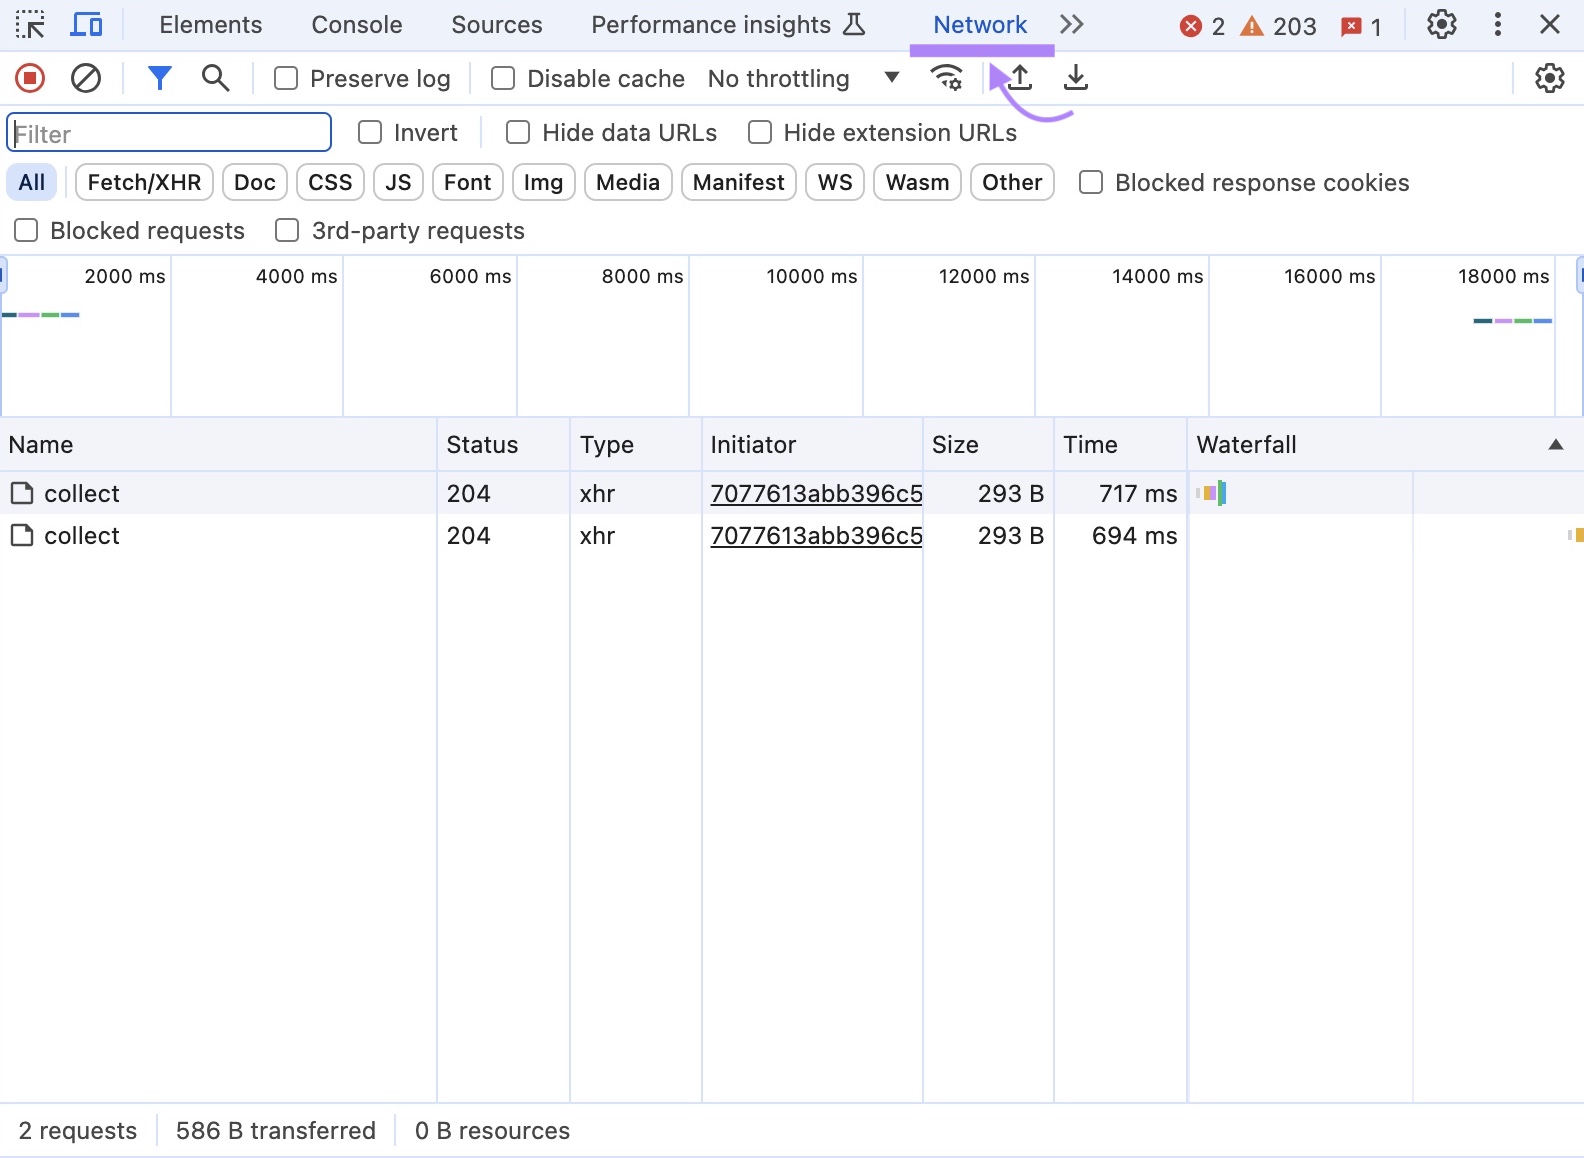
You’ll see the size of each file loaded by the page under the “Size” column. The total size of your page will be listed at the bottom, labeled as “# MB transferred” or “# KB transferred.”
An easy first step to decrease your page size is compressing your images. Use free tools like TinyPNG or Compressor.io to reduce the file size of images without losing quality.
And using system fonts, which are assumed to be installed in most devices, reduces the need to download additional files. To help reduce page size.
You can choose a specific font (like Arial or Times New Roman). Or default to the preferred font in your users’ devices using CSS.
Reduce DOM Size
The DOM is the hierarchical structure that organizes all the elements on a page—like text, images, and buttons. And a smaller DOM is quicker for the browser to process and manage, which can improve INP.
You can simplify your page’s structure by reducing the number of unnecessary HTML elements it has. Like text, images, and buttons.
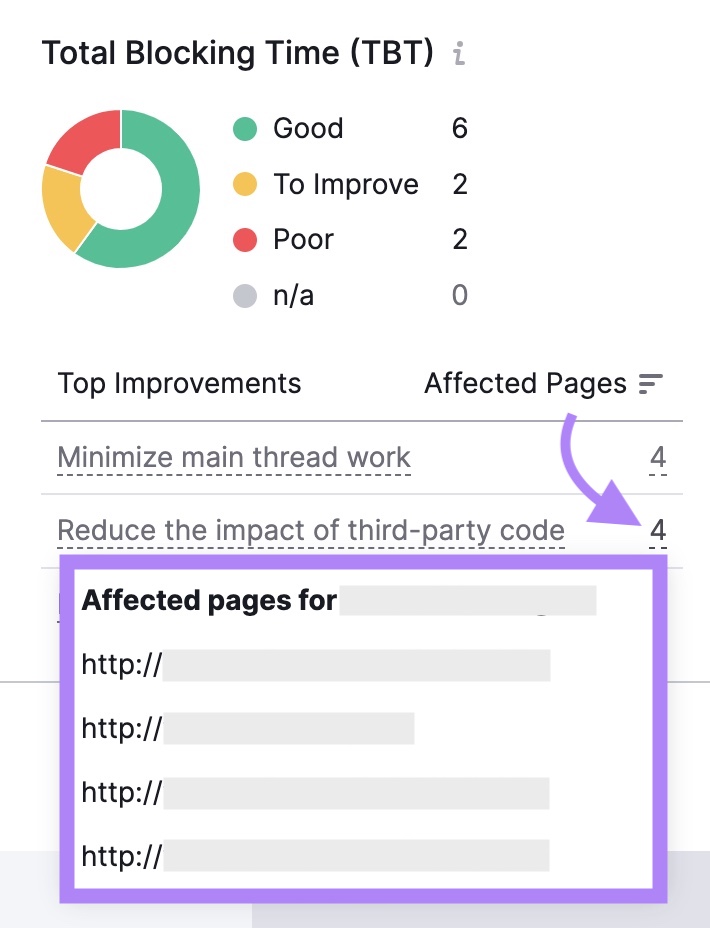
Use Site Audit to identify pages that have an excessive DOM size.
Navigate to your “Core Web Vitals” report, and scroll down to “Total Blocking Time (TBT).” Click on the number in front of the “Avoid an excessive DOM size” improvement.
You’ll see a list of affected pages, like this:
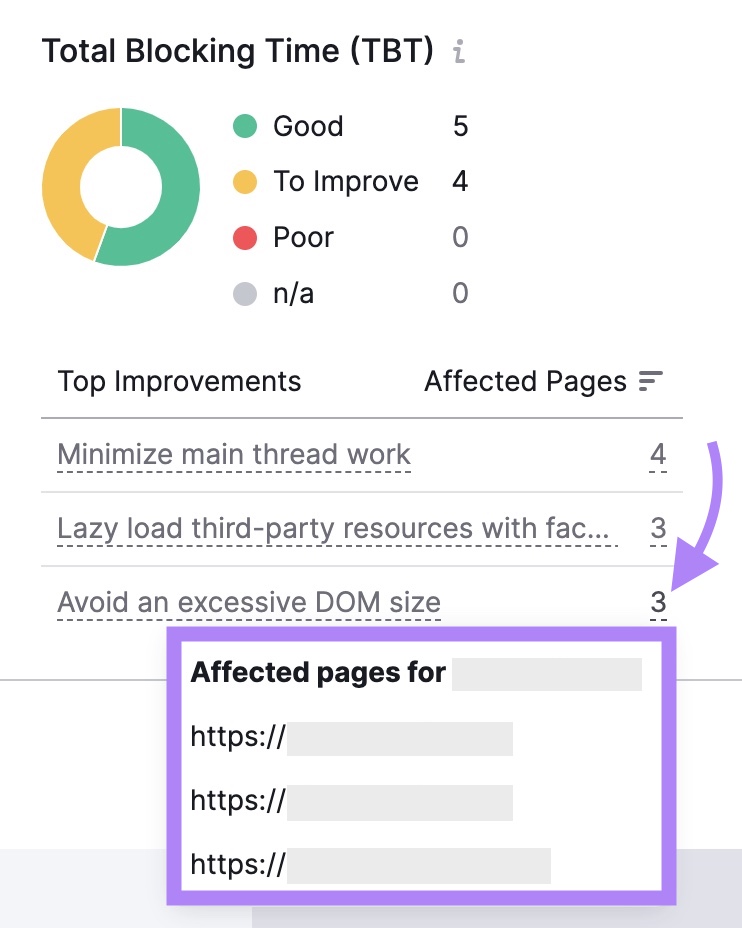
Visit those pages, and see if there are elements you can remove or substitute.
For example:
- Unnecessary images
- Widgets like social media feeds that don’t add value to the user
- Lengthy text that could be condensed
- Duplicate buttons like “Buy Now” and “Add to Cart” that perform the same function
You can also work with a developer to remove the undisplayed elements from the initially loaded page.
To do that, open your site and see what’s visible without scrolling or clicking on anything. These are the parts of your webpage that need to load first.
Parts you don’t see immediately don’t need to load right away.
Ask your developer to help set up your site so that these hidden parts only load when a user clicks a button or scrolls down the page.
Reduce JavaScript Execution Time
Javascript is a programming language responsible for coding dynamic elements like forms, menus, and animations.
Minimizing JavaScript execution time helps optimize Interaction to Next Paint. Because the longer it takes for JavaScript to run, the slower the page is to respond to user requests.
Use Site Audit’s “Core Web Vitals” report to discover pages with slow JavaScript execution.
Your developer can improve these pages by:
- Minimizing and compressing code
- Removing unused code
- Implementing code splitting—dividing code into multiple, smaller bundles
Limit Third-Party Scripts
Third-party scripts are pieces of code that come from outside sources. Like analytics tools, social media buttons, ads, video player embeds.
These scripts add additional functionality and make your page more interactive. But they can also slow down your site by using additional bandwidth and processing power.
If your site has issues with third-party scripts, you’ll find a list of problematic pages in your Site Audit “Core Web Vitals” report.
Go through these pages and consider removing unnecessary scripts. Your developer can also reduce their impact by:
- Delaying loading until the page’s main content is interactive
- Implementing lazy loading
- Optimizing how the site serves third-party scripts
Minimize Main Thread Work
The main thread is responsible for rendering (displaying) the webpage, executing JavaScript, and responding to user requests. Like loading images or updating content.
When the main thread is busy processing other tasks, it can’t respond to user interactions. Which can make your site feel sluggish to users.
Use Site Audit to identify a page’s long tasks.
In your “Core Web Vitals” report, scroll down to the “Analyzed Pages” section. Click the arrow next to a URL with a poor TBT score.
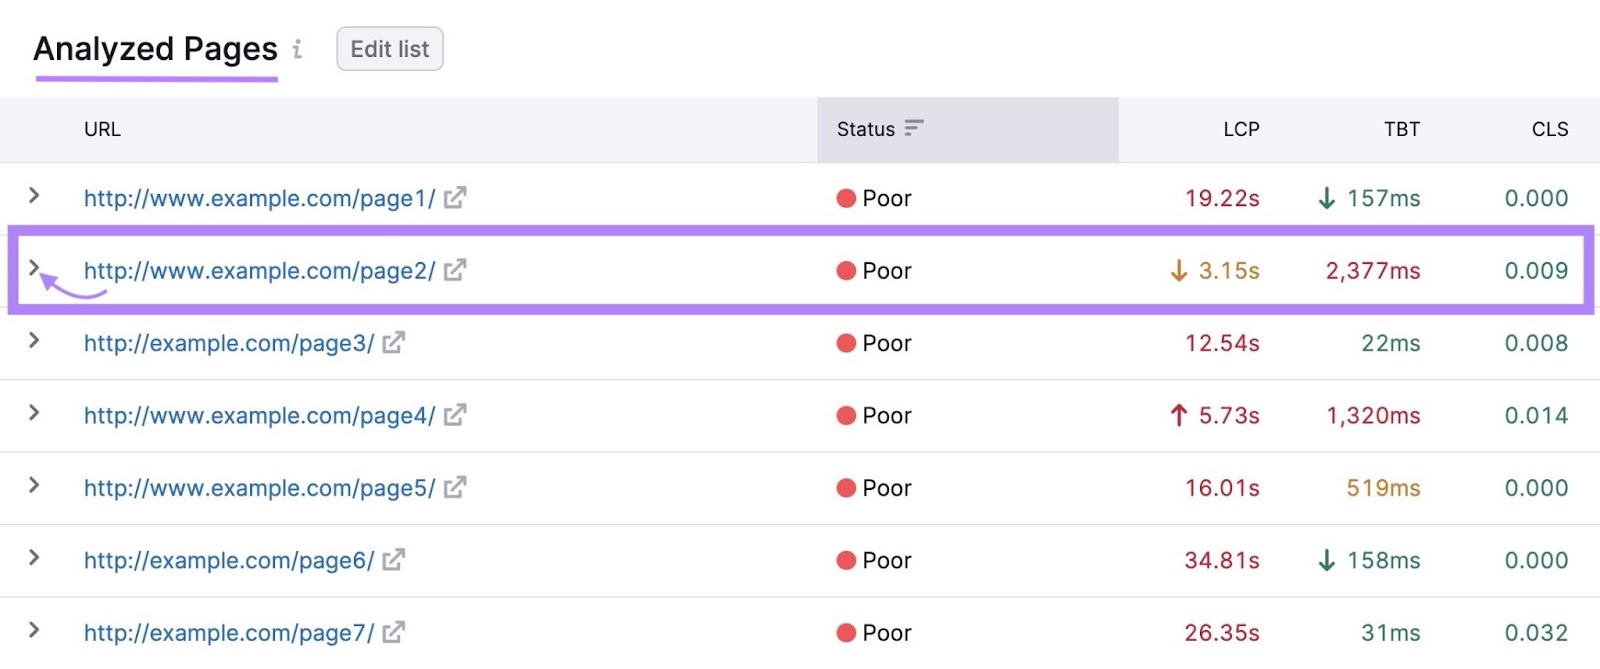
Scroll down to the TBT section for a list of the longest tasks slowing down a specific page.
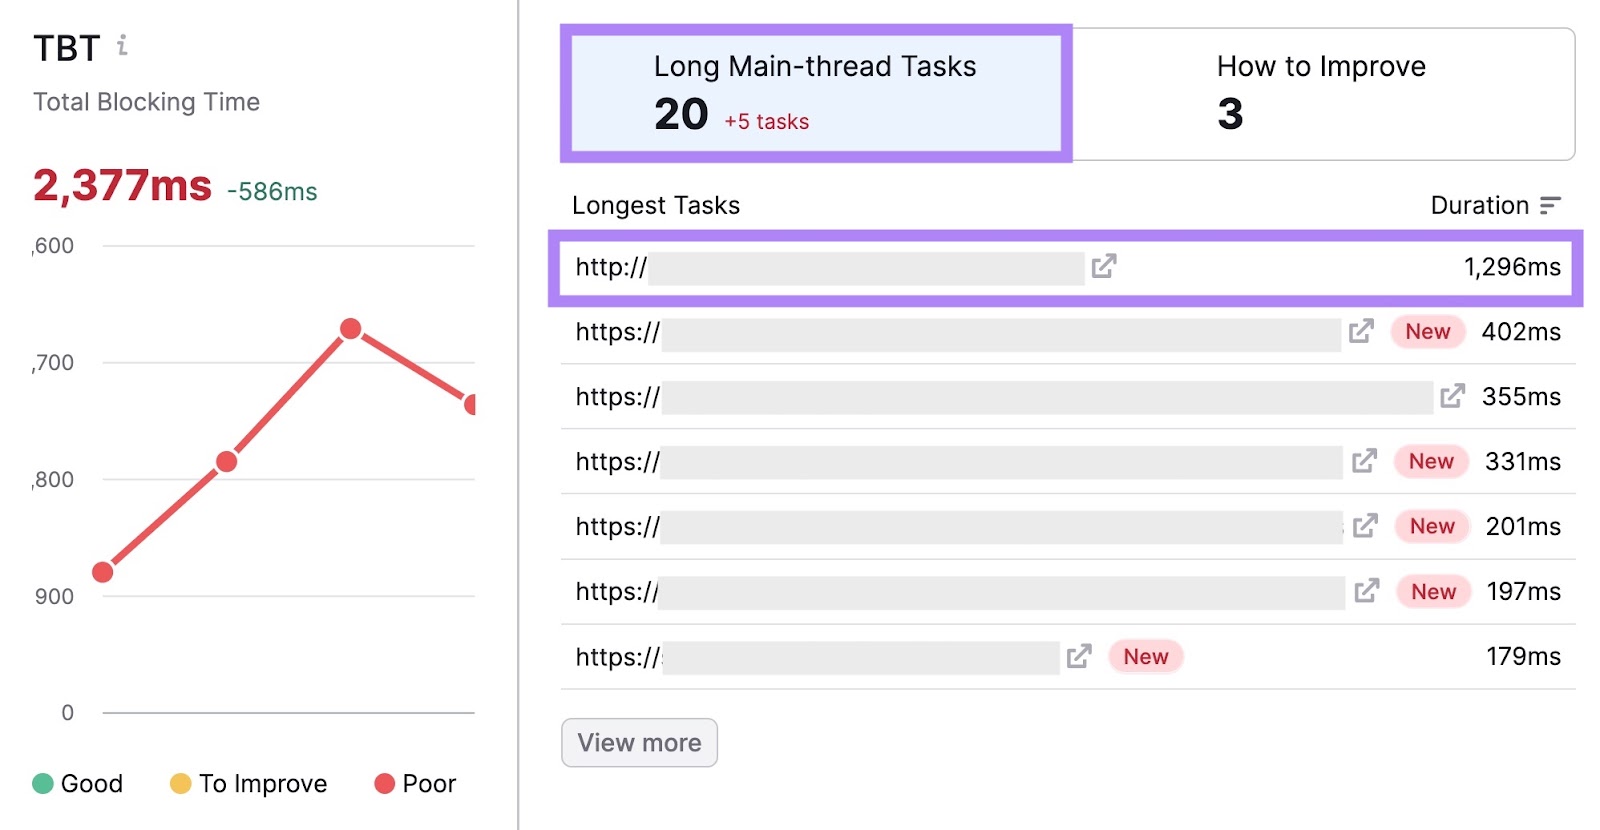
Pass this list on to your developer. They can help resolve the issue through tactics like deferring or removing unnecessary work that blocks the main thread.
Take Steps to Improve Your INP
You want to offer a better UX and achieve higher search rankings. Improving your INP score can help you do that.
Finding issues that might be holding your score back is easy with Site Audit.
Plus, it lets you schedule automatic audits at regular intervals. So you can monitor improvements over time.
Try it today.